

A Staple Diet in a Large Cap | Metcash v Coles
Not the expected stock analysis outcome

Preface
This is a historical analysis from January 2026.
The initial thinking was that Metcash would be a suitable staples sector play. But as the thesis was being written, the conclusion was that Coles (COL) was a better option, even though it is large cap.
This is sometimes how equity research goes, analysis will not form how you initially expect, but ultimately an analyst needs to have a thesis supported by the facts rather than facts supported by a thesis.
At the end of the analysis is a chart showing the performance of Coles and Metcash since January 2026. Coles has outperformed Metcash.
Valuation Summary - Metcash (MTS)
Executive Summary
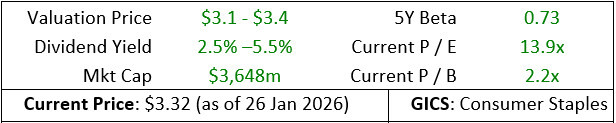
Metcash (MTS) is a wholesale distribution and marketing company specializing in grocery, fresh food, liquor, hardware and automotive parts & accessories. MTS operates in Australia and a smaller liquor business in New Zealand. We calculate MTS was a valuation price range of $3.10 – $3.40 from its current price of $3.32 (26 Jan 2026). A discounted cashflows model was employed.
While Metcash is valued as a defensive stock with stable income characteristics, its limited growth optionality caps the upside relative to large cap peers. In the scenario analysis, the base case only indicates a 4% return over 5 years. Granted this does not include dividends, but the large cap competitors have a higher pay out ratio and large economies of scale.
Lastly, Metcash’s growth and competitive positioning are more constrained. The wholesale model offers defensiveness through independent networks, but the business runs a low margin, meaning any cost inflation or economic shocks risk impacting their business more than a larger competitor. In addition, a larger player such as Coles would provide a greater return in the same theme (defensive staples), a similar dividend yield, similar beta, and an even lower short interest.
Investment Thesis
Metcash is a distributor with exposure to Australian consumer retail. The business benefits from strong relationships with independent retailers providing a stable form of cash flow. This supports a fully-franked dividend for investors. However, growth optionality is limited with the independent retailers as revenue growth for MTS has historically been at low single digits. While Metcash could be included in a portfolio for capital preservation and income, the limited upside makes the larger cap peers, such as Coles, a better alternative.
Catalysts
Metcash has limited near-term catalysts. The capacity for material earnings or valuation upgrades is unlikely given the low growth profile. Stock performance will likely to be driven by Metcash’s stable operations, rather than any big upside events or earnings rerating.
The business continues to benefit from scale and a recent acquisition, supporting better cash flow.
Dividend sustainability is an important factor for investors and is likely supporting the share price. Any change in the dividend expectation will likely impact the share price
Competitive Moat
Metcash’s moat stems from its wholesale distribution network. This creates barriers to entry for smaller competitors. However, compared to Coles, who is a larger owner of its retail operations, loyalty programs, and supply chain, Metcash’s moat is narrower as they do not own their own stores.
Debt & Capital Management
Metcash carries debt but appears to manage it well. The concern is the increasing amount of lease commitments it accumulates according to the annual report.
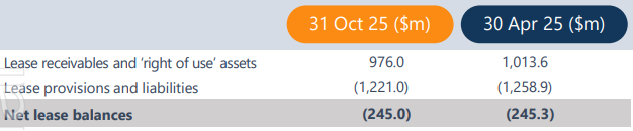
Valuation methods would advise to back the lease commitments as if they were debt, which would increase the debt cost and lower the interest coverage ratio. The leases stay on Metcash’s balance sheet even though the independent owners are using the space. Metcash has the legal liability of the leases for business is doesn’t operate.
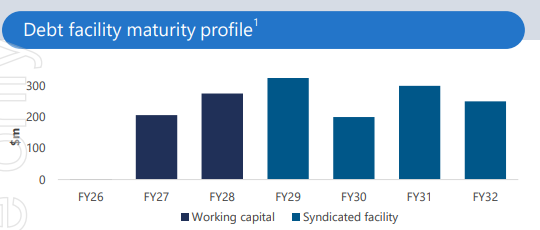
Debt facility maturity profile citation states is does not include lease liabilities, which amounts to $1.2b (December 2025 report)
Aside from this, they appear to manage their receivables book well, with 90% not past due or impaired.
Overall, while leverage is material, it is not at crisis levels, but close attention to earnings and cash flow stability is prudent, especially given sector cyclicality.
Risks & Sell Triggers
Competitive grocery pressures from Coles, Woolworths and discounters could compress margins and independent retail volumes.
Narrow margins could make covering interest payments and lease commitments challenging should inflation, pricing pressures and increase competition erode the margin.
Dividend cuts are a risk if there is any downward revision in earnings. MTS pay out ratio is lower than the large cap peers.
The leases on the balance sheet is a concern if the operators fail to pay.
There is also a risk in the receivables past due not being managed appropriately. At the moment, there does not appear to be an issue.
Thesis breaks would include reductions in dividend payout, narrow miss on guidance, margin deterioration, legal issues arising for the lease agreements.
Valuation
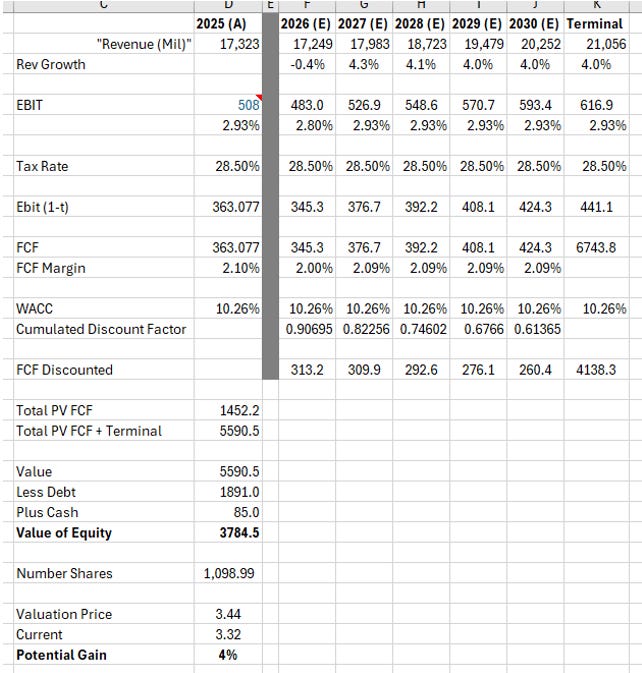
A valuation was conducted using a DCF with a Bull, Bear, and Base case scenario. The changes in each case were the revenue growth driving a FCF figure.
WACC was calculated as 10.3%, using a risk-free rate of 4.84% and an Equity Risk Premium of 11.84%. A simple CAPM model was used to calculate the cost of equity. Cost of debt was found in the annual report.
Using the baseline forecasts in the data, a valuation price of $3.44 was calculated. The figure for EBIT was taken from the latest annual report. The base case on a 5-year valuation estimates a gain of 4% on the current price.
Scenario Analysis
When adjusting the revenue grow rates by 50 basis points in either direction (positive for bull and negative for bear) we can see the small adjustment creates a wide outcome spectrum. Historically average revenue growth rates for MTS are 2.97% (including outliers) or a historical average of 4.20% (not include outlier growth rates).
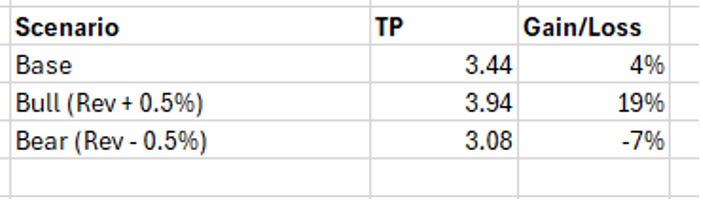
Revenue growth rates, historical have been in the low single digits. As per the data, a 4% growth rate in the model seems achievable. Thus, the base case for MTS is most likely to occur.
Positioning
In a diversified portfolio, Coles would serve as a stronger core supermarket exposure, with integrated retail operations, broader consumer engagement and stronger logistics. In addition, Coles has access to the loyalty program flybuys, providing rich customer data they use for insights.
Metcash could complement Coles’ retail exposure in a portfolio, as it operates in the wholesale distribution market. It also has defensive characteristics although both could result in small portfolio positions that don’t contribute meaningfully to returns.
In terms of growth opportunities, Coles provides a greater chance of growth in a defensive sector from its purchasing power, strong branding, better margins in private label brands, and its strong digital offering (Coles Online).
In addition, should the economy in Australia slow due to changes in monetary policy, consumers are more likely to be cost conscious and buy trusted, cheaper products.
A 3% weight in a diversified portfolio is slightly underweight compared to the ASX200 weight for the sector. This reflects a more cautious approach to positioning given the macroeconomic uncertainty at the start of 2026.
April 2026 MTS v COL Chart
Coles has outperformed Metcash since this analysis took place, with the share price gaining +5% vs Metcash losing -8%
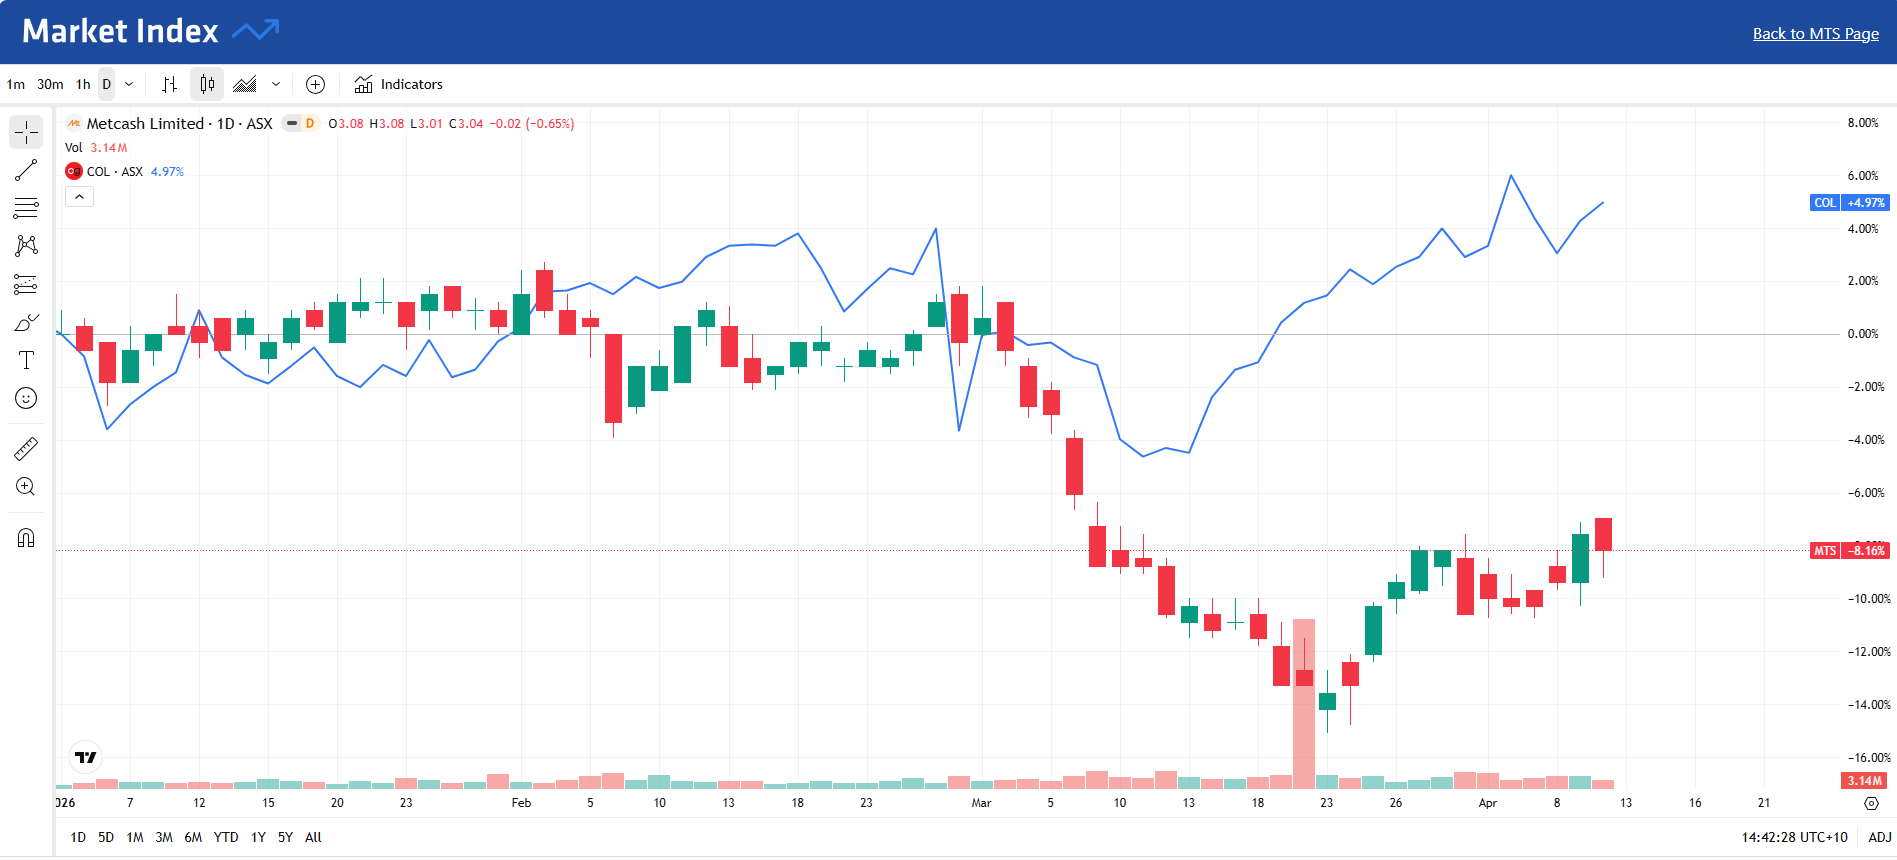
Source: Market Index
Disclaimer: Content is for educational purposes only and does not constitute financial advice. Always do your own research.