

April 2026 - Good Start to Paper Mandate Fund
Monthly Portfolio Performance - 30 April 2026

The inaugural weeks of the Paper Mandate have established a high-conviction baseline. The portfolio successfully decoupled from the broader market index in mid April due to a rally in Technology.
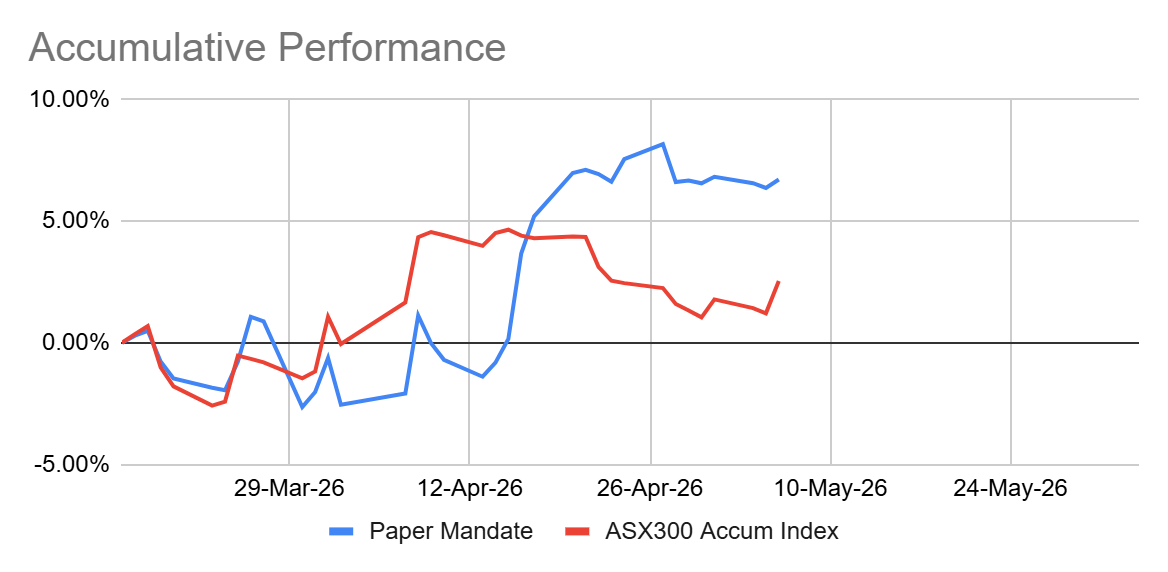
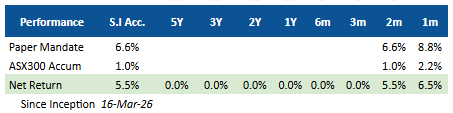
Since the inception date of March 16th, the fund has generated a Net Return of 5.5%, providing a healthy spread against the ASX300 Accumulation Index’s 1.0% return.
While early days, the data provides a clear window into how the strategy is capturing value through active management, specific sector tilts, and a higher than normal cash weight for opportunistic buying.
Active Implementation & Trading Alpha
When calculating attribution, the formula assume a “static” portfolio at the start of the month. This does not take into account the active management over the month. This is important to consider since there was a 50% cash weight at the start of April which was deployed progressively.
This month, the Buy & Hold Active Return of 0.09% was minimum compared to the actual NAV Return of 8.76%. This means there is a 6.49% Trading Effect. It represents the value added through active management intra-month.
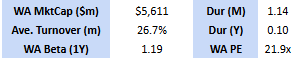
With a lower Average Turnover of 26.7%, the portfolio is quite resilient with all the current market volatility.
Portfolio Attribution
Below is a break down the performance relative to the benchmark. Otherwise known as Brinson Factor Attribution. It reveals whether our returns are coming from good stock picking or good asset/sector allocation.
The most significant move remains the heavy overweight in Technology (19.1% vs. 2.1%), which contributed a 1.7% Allocation Effect. Being in Technology was a benefit, just didnt have enough of the right stocks (-0.2% Selection Effect)
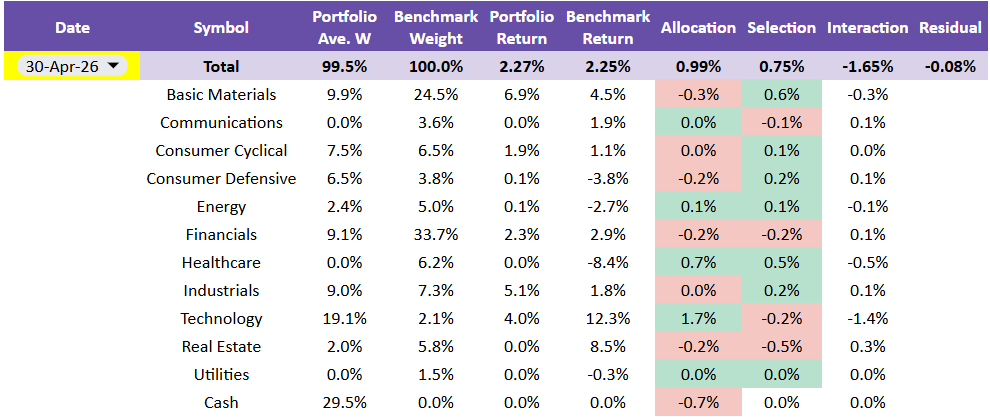
Beyond the headline tech bets, stock selection in Basic Materials contributed 0.6% while the avoidance of Healthcare’s entirely yielded +0.5% in Selection Effect.
An average Cash position of 29.5% created a -0.7% Allocation drag. We started with ~50%. While this impacts relative performance in a rising market, it remains a vital tactical tool for future deployment. The lesson here is to deploy more actively.
Portfolio Characteristics & Risk Metrics
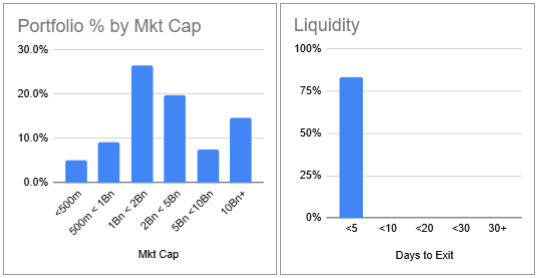
The portfolio’s fundamental metrics were also reviewed regularly. This is for risk management and also to ensure it aligns with expectations. The current profile favours the mid-cap sweet spot, with the majority of companies between $1Bn to $5Bn in market cap.
Monitoring liquidity is also important, assessing how quickly we can liquidate the portfolio in case of a drawdown. Considering a 30% Average Daily Volume (ADV), the portfolio has a Days to Exit of 5 days. This is due to the small FUM size.
Other statistics included the following:
Weighted Avg Mkt Cap: $5,611m, smaller than the $ 9,713m of the ASX300.
WA Beta (1Y): 1.19, indicating a portfolio is more sensitive to the market.
WA P/E Ratio: 21.9x, slightly higher than the ASX300 19.9x trailing PE. Portfolio is slightly more expensive the growthy style.

Sector positioning is monitored daily to understand where the biggest over or underweights are compared to the benchmark. At the end of the month, the largest overweight was Technology (+22.7% ) while the Financials (-18.9%) was the largest underweight.
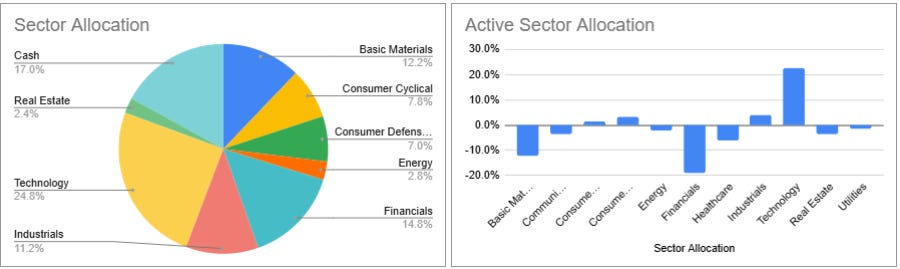
While performance of Financials was similar between the portfolio and the benchmark (2.3% vs 2.9%), a slightly position in Financials would have likely lowered the negative Allocation Effect
Key Contributors & Detractors
The portfolio was driven by growth in Technology and Consumer services. While the actual NAV increased 8.8%, the simple stock contribution uses the prior end of month weight and the current month’s stock performance.
This ensures that we do not include the trading activity over the month, and overestimating the contribution to return.
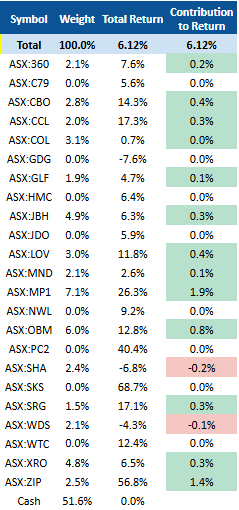
The specific positions that were the drivers of the monthly return, by contribution:
Megaport (MP1): Largest holding at 7.1%, returning 26.3%. Contribution of 1.9%
Zip (ZIP): A 2.5% position returning 56.8%. Contribution of 1.4%
Ora Banda Mining (OBM): A 6.0% position returning 12.8%. Contribution of 0.8%
Outlook & Strategy
The 6.6% absolute return since inception is a fantastic start given the current environment. It validates the positioning at the moment. The focus for the coming month will be; deploying more dry powder, identifying re-rating candidates, and perhaps some repositioning of the weights and/or profit taking of well run positions.
Disclaimer: This is a paper portfolio. Content is for educational purposes only and does not constitute financial advice. Always do your own research.