

Investment Research From Scratch - Part 1
A Practical Journey of Investment Research

This will be a little different than the traditional investment analysis blog. Hopefully this little sub-project within a project doesn’t blow out in scope. But if it does, it will be worth it.
Most investment theses you read online are presented in a complete form. The analysis is done and the models built. Even the online training courses that show you how to build a 3-statement model are simplified templates.
Real world models are never that clean.
Let’s go through a proper investment analysis together. We will start from scratch: understanding the business, collecting the financial data, building the model, balancing the balance sheet (yikes!), and finalising our thesis. Our goal is to share a repeatable process for all your future investment work. And with that, let’s begin.
Our Case Study: Symal Group (ASX:SYL)
Symal has been selected as our company for analysis. A small cap construction, infrastructure, materials and fleet leasing company. It has been a serial acquirer of other businesses that it vertically integrates into its core business.
Symal has a few competitors in the construction space but has very little broker coverage (according to MarketIndex). Considering it listed in November 2024, there is also little history publicly available.
Analysts need to be comfortable dealing with uncertainty and little information. Symal sits in a sweet spot of just enough information to model, without being overly covered by the market.
Setting Up a Research System
Before we go too far let’s get ourselves set up. Having a system to record and store information. For the uninitiated, here is your starting framework
Create a folder system to save documents, annual reports, raw data, and of course your financial model.
Have a place for Note Taking. We will be researching various aspects:
Company Background, Ownership Structure, Business segments, Industry, Capital Intensity, Management, Sell-side, Competitor Analysis and more.
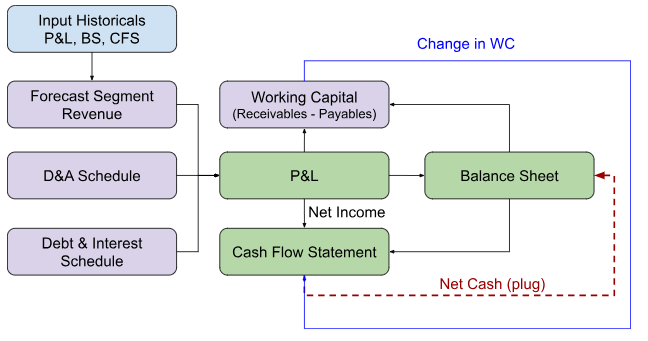
Financial Model: One of the most important parts. Generally the sequence looks as follows:
Input the historical data in all three statements: Profit & Loss (P&L), Balance Sheet (BS), and Cash Flow Statement (CFS).
Forecasting Business Unit Revenue. This drives the revenue in the P&L.
Connect the Business Unit revenue forecasts into the big P&L.
For the BS, we create a working capital schedule using Accounts Receivable, Accounts Payable.
Then PP&E and intangibles schedules (drives D&A back to P&L)
Debt/ Interest schedule, drives P&L and Cash Flow.
Tax (effective rate × pre-tax income)
For the Cash Flow Statement. Every line here is derived from either the P&L or a change in the corresponding Balance Sheet item. Don’t forecast CFS independently.
Finally, Cash from the CFS is your plug back in the BS (Prior cash + net change from CFS). Then the Balance Sheet balances (hopefully).
This is by no means exhaustive and there will be plenty of aspects we’ve brushed over.
Collecting the data
There are many financial platforms that have already aggregated the financial information. The aforementioned MarketIndex does this, Morningstar as well. And most famously, Bloomberg. However, aggregated information is not always in the same format as the financials of the business. We will have to do this the long way; downloading their reports, extracting data from PDFs into Excel and building our own models.
“Why not use AI?” some of the younger readers may cry.
Here’s the hard truth: if you do not understand how the model was built, how will you interrogate the results from AI. If you blindly trust an AI, you won’t spot any mistakes. There is no substitute for doing hard work. But here is the good news: Once you learn to build a clean financial model from scratch once, you can do it for the rest of your investing career, faster and better each time. You could even use AI, because by then you’ll have the skillset to assess its accuracy.
In our next post, we can open up the Symal reports, and presentations to start researching, collecting data and setting up our baseline numbers. Stay tuned.