Paper Mandate has not been able to post our regular daily portfolio note as life, once again, has gotten in the way. There are only so many hours in the day. Today we’ve had the opportunity to sit down and assess how the portfolio went for July 2026.
Unfortunately, July proved to be a challenging month. As Technology was one of the weakest sectors, our portfolio suffered with our large overweight, (-5.52%), while the S&P/ASX 300 Accumulation Index posted a solid gain of +2.13%. This resulting in a relative underperformance of -7.6% for the month.
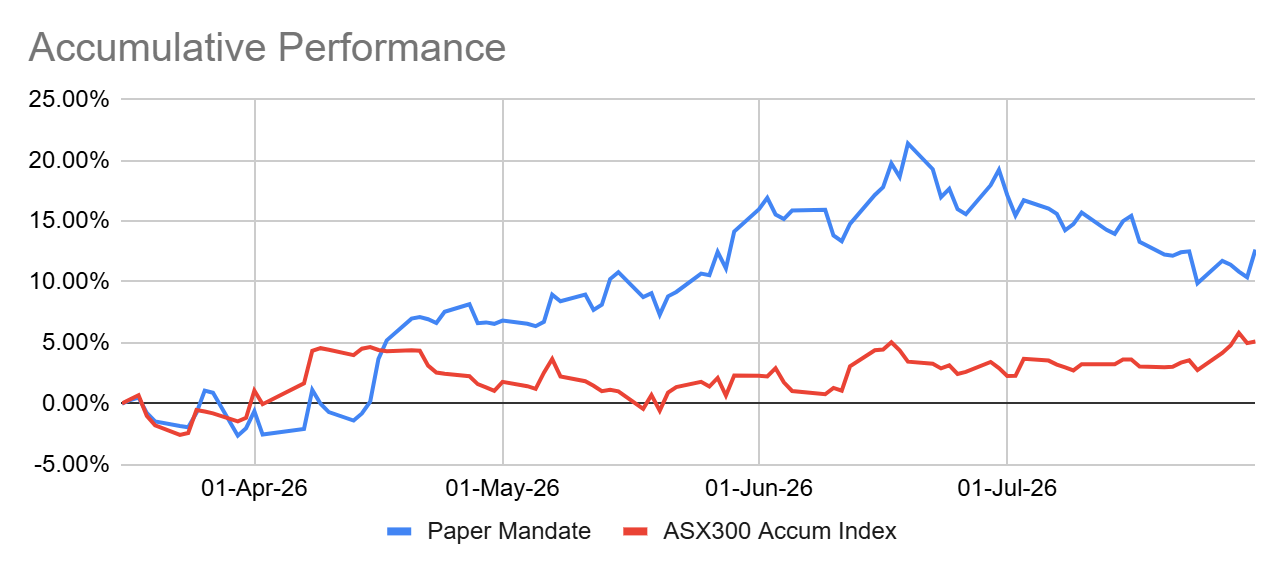
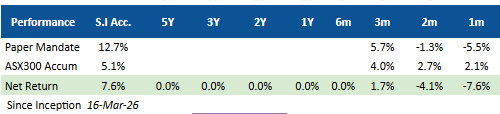
Despite the pullback this month, the long-term track record since inception is still delivering an accumulative return of 12.7% versus the benchmark’s 5.1%, a +7.6% net outperformance. Not bad.
Portfolio Attribution
The portfolio’s monthly return was impacted primarily by stock selection (-9.49%), while sector allocation (-1.59%) also presented a headwind, partially offset by positive interaction effects (+3.14%) and residual adjustments (+0.30%).
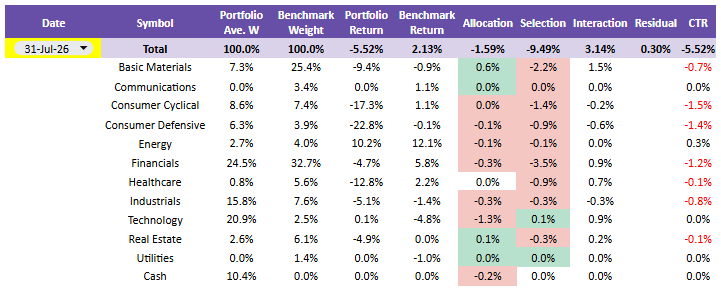
The negative selection effect was due to our stocks in Financials; ZIP specifically was the largest weight and had the deepest price drop.
Consumer stocks (both Cyclical and Defensive) detracted from the portfolio. Defensive dropped -22.8% while Consumer Cyclicals returned -17.3%. This was due to holdings in JBH, LOV, and CBO.
Energy was the only bright spark, returning +10.2%, driven by WDS.
Key Contributors & Detractors
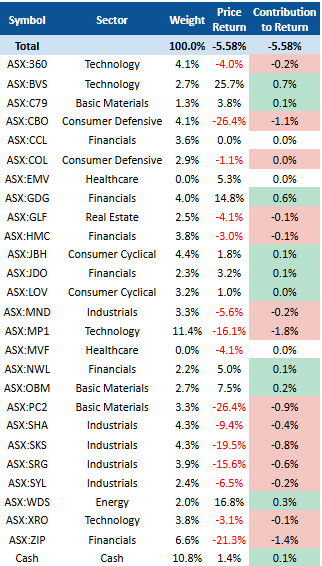
The NAV decreased -5.52% during July. The specific positions that drove the return by contribution were:
Bravura (BVS): Rose +25.7% and contributing +0.7% to total return
Woodside (WDS): Up +16.8%, adding +0.3% to portfolio return.
Generation Development (GDG): Advanced +14.8%, contributing +0.6%.
Key detractors were:
Megaport (MP1): Fell -16.1%, detracting -1.8% with a portfolio weight 11.4%
Zip (ZIP): Dropped -21.3%, detracting -1.4% contribution to return impact.
Cobram Estate (CBO): Declined -26.4%, detracting -1.1%
Portfolio Characteristics & Risk Metrics
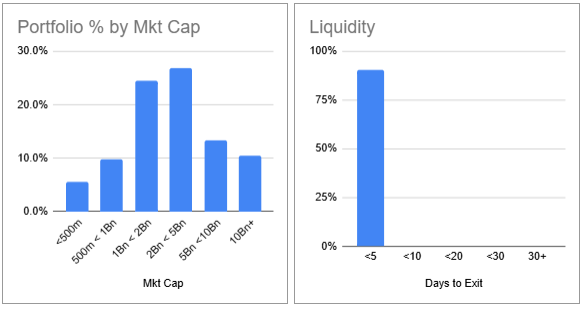
The current profile favours the mid-cap sweet spot, with the majority of companies between $1Bn to $5Bn in market cap. We have increased our $1bn to $2bn bucket since last month.
The portfolio liquidity remains the same. Considering a 30% Average Daily Volume (ADV), the portfolio has a Days to Exit of 5 days. This is due to the small FUM size.
Other statistics include:
Weighted Avg Mkt Cap: $5,309m, higher than last month again.
WA Beta (1Y): 1.19, up from 1.07 indicating a more sensitive portfolio.
WA P/E Ratio: 22.6x, down from last month

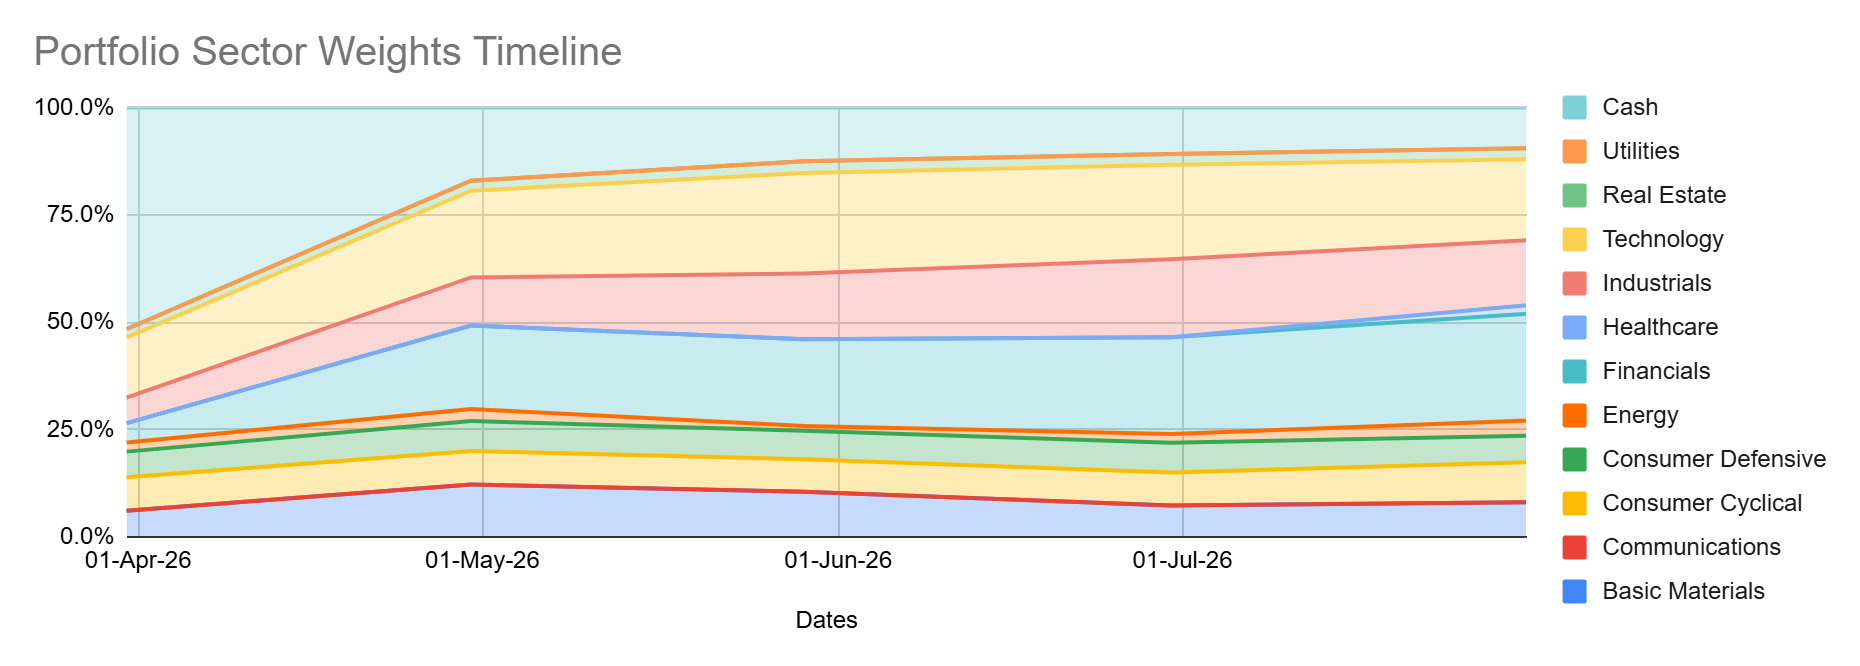
At the end of the month, the largest overweight is still Technology (+16.6% ) but this is lower than the 19% from June. Materials continues to be our largest underweight but is closer the benchmark than the prior month (from -17.2% to -16.6%).
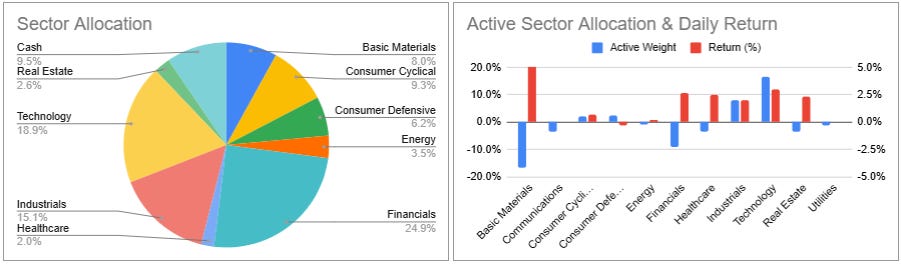
In difference to last month, we initiated on our first Healthcare names: MVF and EMV. We also reduced our weights in MP1 and SKS, taking profits as they had a good run.
Outlook & Strategy
While a down month is never our goal, we are happy with a 12.7% absolute return since inception and the positioning and the fund is solid. We will likely make further changes to the Materials and Technology allocation as the AI sentiment turns from “risk on at any cost” to “risk off from valuation stretch”.
The focus for the coming month will be to again strategically deploy dry powder, continue trimming successful stocks like MP1, and rotate from a high beta tech heavy allocation to more Industrial or Consumer. We will have to see how the market plays out.
Disclaimer: This is a paper portfolio. Content is for educational purposes only and does not constitute financial advice. Always do your own research.