

Life Sciences Software w/ 80% Margins | Veeva Systems (VEEV:NYSE)
A critical life science software trading at a discount to intrinsic value.

Authors Notes
Something outside of Australia. Came across this stock while reading other publications. As sectors, Software and Healthcare have sold off, and this is both (a contrarian’s dream). This is definitely something interesting to analyse. Let’s go!
Key Points
Veeva’s dominant market share in critical life sciences software, paired with its status as a Public Benefit Corporate (PBC), secures high customer retention and structural margin stability.
Global life sciences R&D spending remains structurally above pre-pandemic level, acting as a tailwind for the Development Cloud. Crucially, the migration from Salesforce to native Vault CRM removes 15% to 20% royalty fee. This shifts the product mix towards a higher gross margin.
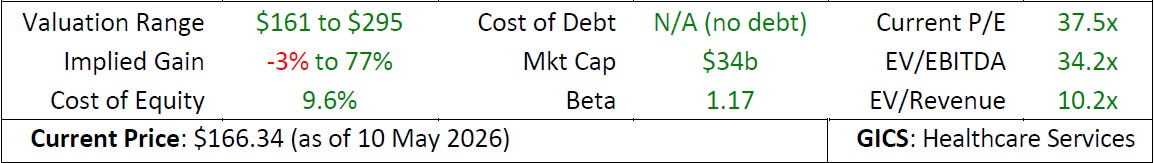
Blending multiple valuation methods under conservative growth constraints yields a BUY recommendation with a weighted price of $231. Against the current price of $166.34 (as at 10 May 2026), this implies a 39% upside potential. Our stress tested scenario range ($161 bear to $295 bull) show the current market is sitting at our valuation floor
Valuation Summary
Executive Summary
Veeva Systems (VEEV) recommended as a BUY with a weighted target price of $231, representing an implied upside of 39% from its current price of $166.34 (as of 10 May 2026). Our scenario analysis establishes a valuation range of $161 (for the bear case) to $295 (for the bull case), indicating the current price is trading at a discount.
Multiple valuation methods were utilized to provide a comprehensive assessment and eliminate single-model bias. The $231 target price is derived from a cross-functional valuation matrix incorporating a 3-statement DCF model (anchored by a 9.6% WACC), peer multiples overlay, and a sell-side consensus aggregation. Sensitivity tables were used to stress-test the outputs of the model, varying WACC and terminal value assumptions.
Veeva trades at a premium to its peers, commanding a 37.5x P/E multiple against a 24.8x peer median. This premium is justified by Veeva’s 80% gross margins and dominant market share. To ensure a structural margin of safety, our baseline 3-statement projections integrate a conservative, below historical growth factors to establish a floor.
In addition, conservative growth assumptions were used in the 3-statement model to provide margin of safety to the downside. The current trading price offers a suitable entry point significantly below intrinsic value.

Investment Thesis
Dominant Moat: Veeva provides mission-critical software for a highly regulated industry with high switching costs. Retaining 12 of the top global pharma giants through the Salesforce migration proves the product inelasticity. On average, enterprise clients use 4 or more Veeva modules, creating an interconnected ecosystem. Furthermore, the transition provides an opportunity to upsell to customers onto the Veeva Vault
Margin Expansion: The Vault CRM migration is outperforming expectations, with Veeva pulling forward the legacy platform end date from 2030 to December 2029. This will eliminate of the 15% to 20% Salesforce royalty fee drag by 12 months, driving an immediate improvement in operating margins.
Favourable Tailwinds: Global R&D funding remains structurally above pre-pandemic levels, with the industry shifting towards more complex, high-value clinical studies. Veeva’s R&D segment accounts for 55% of its business, and is growing at double digits, well-positioned to capture any increased R&D spend from big pharma.
AI Implementation: There has been keen interest from Veeva’s clients regarding the integration of AI agents into the platform. The company is currently investigating token-based pricing models for AI. Present AI use cases are operating at 45% margins, which is dilutive to Veeva’s core 80% subscription baseline. This margin gap is driven by third-party cloud computing pass-through costs via Amazon Bedrock. If AI token consumption scales rapidly to 10% of the overall revenue mix, it will create a 400-basis point contraction in blended corporate gross margins that consensus estimates have overlooked.
ESG & Shareholder Alignment: Veeva has a strong balance sheet with $5.1b in cash equivalents and zero debt. The Board announced a $2 billion share buyback program, signalling baseline valuation confidence. However, Veeva’s heavy use of stock compensation results in a slow dilution for equity holders. This $2billion buyback acts as a sterilisation mechanism, absorbing the effects of the SBC dilution. In addition, Veeva’s SBC, positive option-exercising rules, and pay transparency strongly align management and employees with shareholders and showcases strong governance.
Key Risks
Client Concentration: Veeva counts 14 of the top 20 global pharmaceutical companies as clients, representing 35% of subscription revenues. Contract churn is cyclical and capped by platform switching costs. A 20% pullback in spend from just two of these sponsors, creates a $45 million headwind to recurring subscription revenue. Management's mitigating this risk by increasing the win rate of mid-market clients. Mid-sized accounts require less custom implementation, yielding better margins compared to the customized enterprise contracts of the top 20.
R&D Spending: While current funding indicators remain elevated, any regulatory contraction in clinical trial volume would immediately hit Veeva's high-margin subscription layer. CRO backlogs and China-sponsored trials act as a primary leading indicator; a systemic 5% contraction in global R&D budgets would directly impair our core revenue growth forecast, compressing our baseline target valuation toward our $161 Bear case floor.
Auditor Risk: Veeva’s external auditor has been servicing the company for 10 years. Governance best practices generally suggest rotating auditors or retendering the audit contract every 5 to 7 years to prevent the "rubber-stamping" of financials and to ensure independent oversight. While not an immediate red flag, it is a governance risk worth monitoring. Furthermore, the auditor has previously highlighted the inherent complexity of auditing Veeva’s revenue recognition, given the sophisticated nature of the business and the various systems used to track and record multi-product customer spending. This system complexity increases the tail risk of revenue recognition.
Company Overview
Veeva is a provider of cloud-based software tailored for life sciences, serving over 1,400 customers. Their unique offering is a turnkey software platform that smaller companies can use to conduct trials and studies, while larger clients are able to customize packages.
Uniquely, Veeva is a Public Benefit Corporation (PBC), legally mandating the consideration of all stakeholders and make a positive social or environmental impact alongside profits. This is a structural alignment mechanism that lowers regulatory risk and insulates the company from predatory short-term pricing practices, securing multi-decade customer retention. PBCs are legally required to consider the impact of their decisions on all stakeholders (including employees, communities, and the environment) and to regularly report on these matters.
Veeva’s global headcount stands at 7,928 employees, reflecting a disciplined 8.7% year-over-year expansion (+637 FTEs) with 4,194 personnel concentrated in the United States. Crucially, this headcount growth tracks below Veeva’s revenue expansion, proving that the business is scaling its global infrastructure without inducing a corresponding linear expansion in personnel costs

Debt & Capital Management
Veeva is led by its principal founder and CEO, Peter Gassner, who maintains a strong alignment with 7.5% of shares. The company enjoys significant institutional backing from investment firms such as Vanguard, BlackRock, T. Rowe Price, and Alliance Bernstein, among others holding about 98% of the free float.[1] The highly institutional support limits retail and wholesale participation creating a tight float environment prone to price volatility during quarterly earnings.
As a core part of the company’s compensation philosophy, Veeva regularly grants equity to its employees. While this stock-based compensation creates a 2-3% dilution drag for equity holders, it builds strong staff alignment with shareholders.
This is reflected in the leadership team as well, with an average tenure of 9 years, with several senior personnel exceeding 10 years. The institutional memory lowers execution an operational risk. A full list of key directors containing the titles and tenures is located in the Appendix.
[1] https://finance.yahoo.com/quote/VEEV/holders/.
Short Interest
Short interest has historically been low for Veeva. Currently, short interest sits at 3.92% of the free float, which represents its highest level in the last 5 years. This increase in short interest originally spiked in late 2024 reflecting market anxiety over the execution risks tied to the Salesforce-to-Vault CRM migration announcement. While the total percentage of shorted float remains minimal, the subsequent share price contraction from approximately $300 down to around $165 has fully priced in this migration friction, exhausting the original bear thesis. Because institutional blocks lock up 98% of the public float, the active trading liquidity pool is exceptionally thin.
Any positive operational update regarding accelerated Vault CRM migrations or better-than-expected margin preservation will act as an upward catalyst. This setup forces short sellers to compete for scarce available shares to cover.
Recent Earnings Call
Veeva held a results call in March 2026. It was mainly Q&A from sell-side analysts. Key insights drawn from the call were:
AI Implementation
Management confirmed that AI modules will be priced using a token-based system, indicating early demand for the modules.
Crucially, margins for this model are 45% currently, which will be dilutive to the core revenue margins of 75-80%. The lower AI margin is driven by pass-through costs via Amazon. While management expects the unit economics to expand overtime, near-term margins may compress if the modules scale.
Salesforce Split
Management projects that the legacy CRM business will contract from 20% of total revenue down to 10% by 2030. This contraction reflects structural product mix diversification rather than absolute customer churn.
As customers migrate to Vault CRM, legacy Salesforce royalty fees will systematically roll off.
The migration of customer onto Vault CRM has been a major upsell catalyst with moderate uptake. Company on track to migrate 14 of its 20 top clients.
Customers
The Development Cloud (R&D Segment) continues to outpace the Commercial Cloud growth
Veeva is has successfully captured 140 mid-sized accounts. Management confirms the win rate in the midsize market has been higher than the Top 20 providing a long tail of smaller customers using turnkey configurations requiring minimal implementation.
Guidance Updates
Veeva will no longer provide quarterly guidance, opting instead to report on rolling trends to better reflect long-term business health and discourage short-term public market positioning.
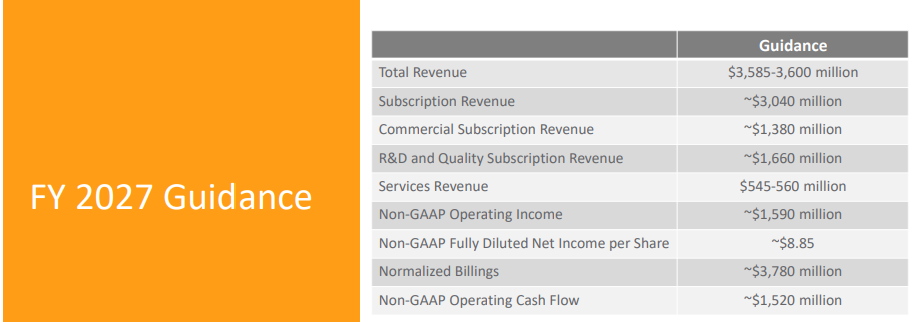
Current guidance tables assume stable macroeconomic and pharmaceutical budget stability, signaling that any subsequent recovery in clinical trial volumes represents upside.
JPM Health Conference 2026
Management reaffirmed full-year FY27 financial guidance, confirming that over 115 enterprise customers are now live on the native Vault platform. This confirms steady execution momentum and mitigates immediate technical roll-out concerns.
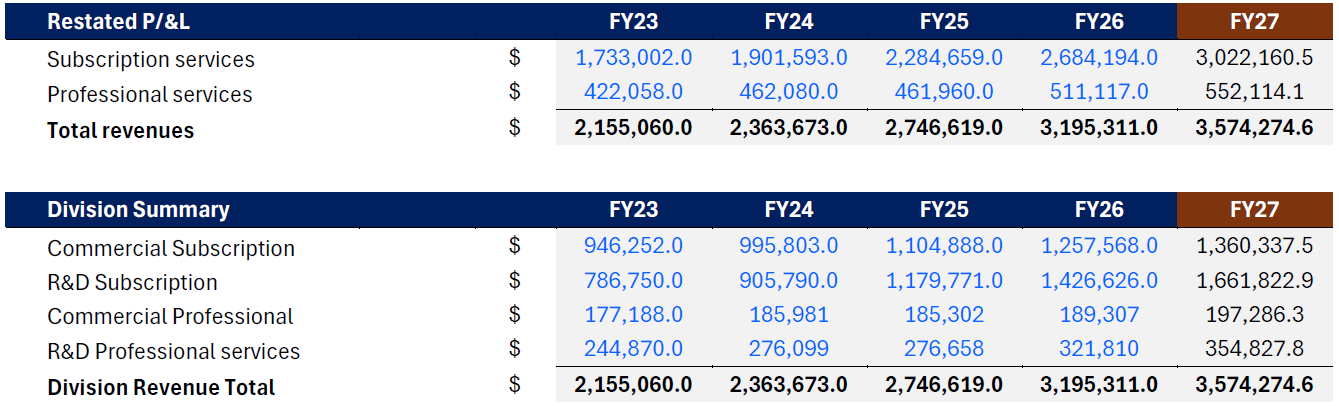
Our 3-statement model projects FY27 total revenue of $3,574m, establishing a conservative floor that sits slightly below management’s $3,585m guidance midpoint. To eliminate historical growth distortions, our baseline forecast uses a harmonic average of historical quarterly revenue growth rates. Isolating Commercial and R&D subscription reveals our baseline numbers match management’s internal pacing almost exactly. This alignment yields two structural insights:
a) Veeva is using conservative growth estimates to cushion variation in actuals versus forecasts.
b) Consensus sell-side analysts are using optimistic growth rates, based on their published target prices.
Management does not explicitly break out Professional Services dynamic. The simultaneous execution of the Salesforce exit and the deployment of net-new AI modules will drive a short-term demand for specialized migration and data-cleansing assistance from Professional Services.
In addition, management maintains a clean track record of outperforming consensus and guidance GAAP EPS expectations. The historically strong execution and our conservative baseline ensures a margin of safety for our recommendation.[1]
[1] https://finviz.com/quote?t=VEEV&p=d&ty=ea.
Business Model & Segments
Veeva operates a high-margin Vertical SaaS business model structured around two core pillars: Subscription Services (84% of total revenue) and Professional Services & Consulting (16% of total revenue). This revenue mix is segmented across two primary operational categories:
Commercial Solutions
Commercial Solutions consists of comprehensive applications to assist in sales, marketing, and getting a product ready for launch. According to management, the total addressable market, or TAM, for Commercial is $6B.
Applications include Veeva CRM, which currently accounts for 20% of the business, Veeva Vault Medical for medical inquiries, Veeva Crossix, which is a newly acquired privacy platform, Veeva Open Data for sales, and other lower revenue applications.
Commercial represents 45%of the business as of FY26, down from 52% in FY23 reflecting the intentional shift in to the faster growing R&D segment. Revenue growth rates are usually in the high single digits, with the exception of FY26 which achieved 12.1% growth
Commercial solutions have blended gross margin of 80%, where subscription gross margins sit at 88%, offsetting the lower professional services margin baseline of 17%.
R&D Solutions
R&D Solutions includes development applications spanning clinical, regulatory, quality, and safety functions built into Veeva Vault, its premium platform, with a TAM of $3b. R&D Solutions support clinical drug development, with the primary goal to streamline the trials process which is known to be fraught with bottlenecks.
R&D represents Veeva’s primary engine of growth, expanding at double digits (+23% in FY25 and +20% in FY26). Driven by the shift toward complex, multi-site biopharma trials. We model R&D expand from 55% of total revenue in FY26 to 62% of the blended corporate revenue mix by FY31
Blended gross margins match the commercial segment at 80% but feature better dynamics. While R&D subscription gross margins sit at 87%, the segment’s associated professional services command a higher 44% margin baseline (compared to Commercial’s 17%).
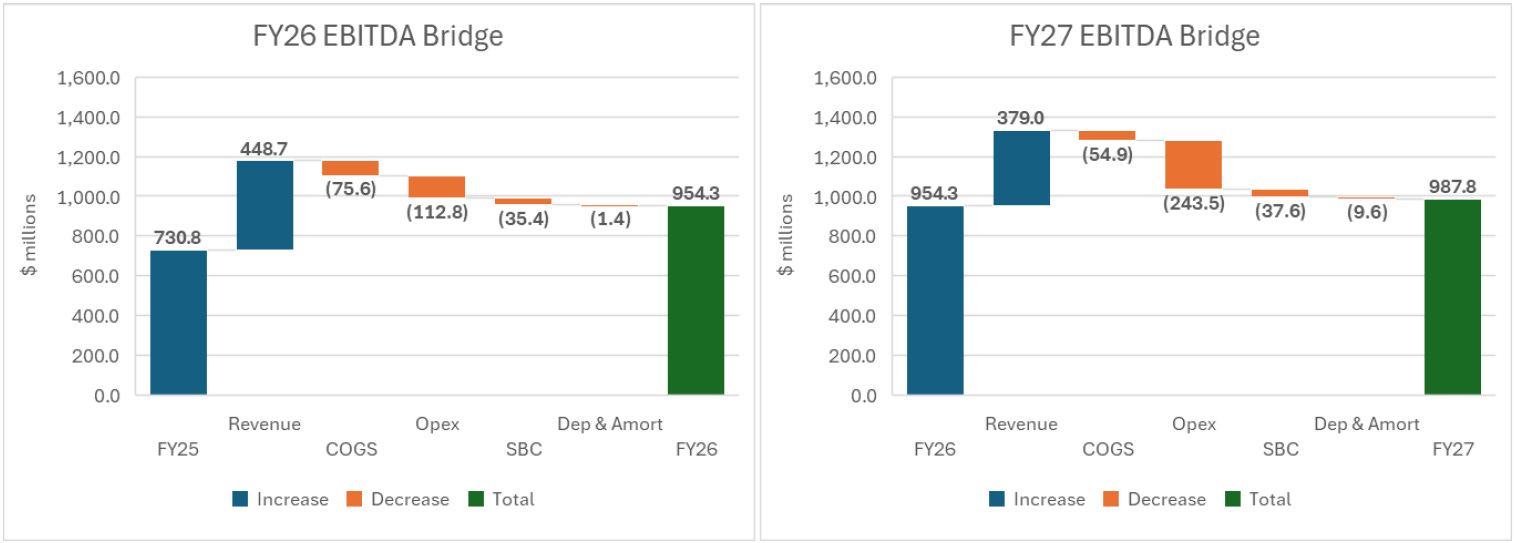
EBITDA Bridge
Direct software delivery and infrastructure hosting costs are minimal. Corporate outlays are heavily weighted toward employee-related operating expenses across R&D, Sales & Marketing, and General & Administrative (G&A)
When isolating Stock-Based Compensation (SBC) as an independent operational layer, the non-cash equity issuance unmasks the true cash generation capacity. Management confirms a majority of their costs are employee related expenses.
Using the assumptions in the valuation model for FY27, we can see operating expenses increase dramatically.
Regulatory Environment
Veeva operates within a highly regulated industry. Their clients are governed by the FDA in the United States and the EMA in Europe. Its software is specifically designed to help clients maintain compliance with these regulations. Veeva looks to help medtech and pharma firms navigate data privacy and clinical trial transparency laws through its Unified Strategic Platform. [1]
Over the last two US presidential administrations, there have been two key pieces of legislation with differing impacts on the industry:
Inflation Reduction Act (IRA): This law introduced Maximum Fair Price negotiations. It establishes a mandated ceiling price where the Secretary of the Department of Health and Human Services is authorized to directly negotiate the Maximum Fair Price for eligible drugs.[2]
The IRA acts as a double-edged sword. While it pressures pharmaceutical margins and subsequently tightens software procurement budgets, it simultaneously creates an acute need for robust compliance and data transparency tools.
The One Big Beautiful Bill Act (OBBB): This legislation restored 100% tax deductions for domestic R&D expenditures. This acts as a counterweight to the pressures of the IRA, incentivizing Veeva’s customers to keep their clinical trial operations within the United States, which directly benefits the Veeva Development Cloud.[3] Consequently, we are likely to see lower operating expenses for domestic drug R&D, potentially freeing up more budget allocation for specialized software. The OBBB also enacted roughly $1 trillion in Medicaid cuts, forcing manufacturers to expand patient assistance programs and discount tracking. This higher regulatory complexity further drives commercial demand for Veeva’s applications to manage contracting and rebates.
Global Data Privacy Regulations: Veeva is subject to strict data privacy laws globally. This includes HIPAA in the United States, the EU GDPR in Europe, the UK GDPR in the United Kingdom, and the PIPL in China. In these jurisdictions, Veeva processes data on behalf of customers who operate as data handlers. These laws govern and protect how sensitive health information is collected, transferred, and maintained.
[1] Veeva website
[2] https://www.scirp.org/journal/paperinformation?paperid=150681
[3] https://www.ballardspahr.com/insights/alerts-and-articles/2025/08/impact-of-the-one-big-beautiful-bill-act-on-the-life-sciences-industry
Industry Environment
Clinical trials are long, complex processes with a high amount of regulatory compliance. Early clinical trial software applications streamlined operations by moving workflows from pen and paper to online environments. Previously, patients’ clinical trial data was collected manually in a medical chart. Transcriptions were done by a nurse, who then faxed the records to the pharmaceutical company or to data management teams.
Electronic data capture, or EDC, allows patient data capture during the patient visit, which improves real-time insights. Trial sponsors have increasingly adopted software, driving rapid growth for application providers
Biopharma R&D spending is the primary driver for Veeva’s software. A report from IQVIA, a competitor to Veeva, stated that despite pricing pressures, the industry is seeing a shift toward high value studies and trials alongside AI enabled efficiency.[1] The same report indicated that R&D funding levels remain well above pre-pandemic levels. [2]
Some insights from the 2026 report were:
R&D deals between China-headquartered and international companies reached an all-time high.
Clinical trial starts are increasingly concentrated among US sponsors.
The small molecule share of trial starts has experienced a long-term decline in all development phases. This indicates the shift to high value, complex, science.
These industry trends should drive further adoption of software and data. VEEV’s products address many of these issues and should capture more wins as a result.
Another report from ZS also stated that R&D spending is shifting in favour of high value assets and toward Chinese biotechs.[1] Asia as a segment account for 10% of Veeva’s revenues. This is expected to grow in future. For financial modelling purposes, regional exposures were kept consistent.
In 2023 Veeva held 26.8% market share, followed by IQVIA 17.7%, Salesforce 16.4%, and Oracle 11.2% according to Intuition Labs. They estimated the total TAM at $20 billion in 2025/26. This implies roughly 16% market penetration by Veeva based on its $3.2 billion revenue in FY26.
The software industry has high switching costs. Moving platforms takes significant time, money, and organizational training to achieve full system integration. This dynamic explains why 14 of Veeva’s top 20 clients choose to stay on their platform rather than moving to a competitor like Salesforce during the recent platform split.
[1] https://www.zs.com/insights/pharma-industry-outlook-2026
[1] https://www.iqvia.com/insights/the-iqvia-institute/reports-and-publications/reports/global-r-and-d-trends-2026
[2] https://www.iqvia.com/insights/the-iqvia-institute/reports-and-publications/reports/global-r-and-d-trends-2026
Competitive Moat
In terms of its competitive advantage, Veeva Systems high switching costs keep customers sticky, which is especially advantageous because pharmaceutical clients must maintain constant regulatory compliance.
The platform continually strengthens this moat as customers adopt more modules. As of FY25, major customers owned an average of four or more products, making their operational workflows integrated and difficult to replace[1]. Veeva has a portfolio of about 40 products that it can cross sell to its user base.
Veeva is also innovating constantly to design and create new software solutions for its clients. At present, there are 111 current patents expiring between 2028 and 2048, alongside another 164 pending patent applications.[2] This protects their core intellectual property and securing future growth avenues.
Competitors
Veeva has a range of competitors in the space including Oracle, and Salesforce. Below are two closer competitors described.
Certara: Accelerates medicines to patients using proprietary biosimulation software and technology to transform traditional drug discovery and development. Its clients include global biopharmaceutical companies, leading academic institutions, and key regulatory agencies across 60 countries. They are one of the smaller competitors.
IQVIA: Main competitor. Provides biopharmaceutical development, commercial outsourcing, information services, and technology tools on a global basis. Operating in over 100 countries across the Americas, Europe and Africa, and the Asia-Pacific. The company primarily serves biopharmaceutical companies, as well as other healthcare companies.
In terms of a comparison to direct peers, VEEV is trading at a premium to its peers at a PE of 37.5x (51% premium), and EV/EBITDA 34.2x (135% premium). In terms of Gross Margins, VEEV has a higher margin for its products (75% vs 61% average).
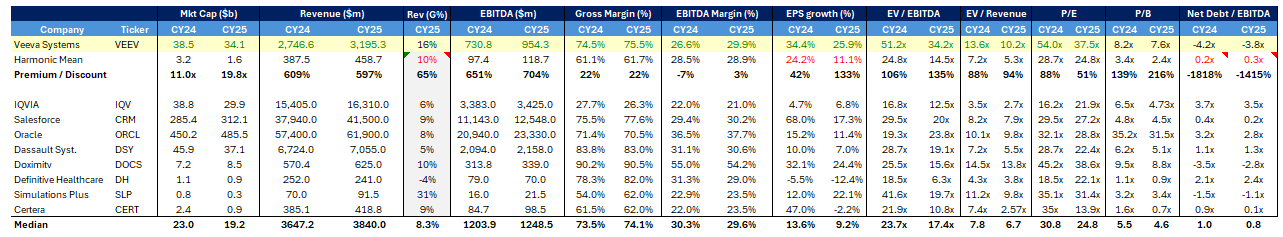
Veeva looks expensive to peers on EV/EBITDA and PE multiples.
[1] https://intrinsicinvesting.com/2024/07/23/veeva-a-winning-platform-strategy-in-life-sciences
[2] Veeva 2026 annual report
Capital Management & Balance Sheet
Veeva has an asset light, highly liquid balance sheet, and they carry zero debt. Cash consists of 16% of assets, totalling $1.4 billion, and their short-term investments consist of 57% of assets, totalling $5.1 billion. The net effect of investments maturing and the purchase of new securities is roughly 30% of revenue. Veeva is very well capitalized, with plenty of dry powder to execute strategic objectives, launch new products, and complete acquisitions. Their presentation at the JPM Healthcare Conference explicitly mentioned strategic acquisitions as part of their capital allocation focus.
In terms of their business model, cash flows and receivables exhibit high seasonality, with a distinct spike occurring in the fourth quarter of each fiscal year when customers renew their subscriptions for the following year. At the same time, payables remain very low, meaning Veeva pays its obligations promptly. This dynamic is validated by the working capital cycle metrics.
Days sales outstanding was 130 days in FY26, reflecting standard enterprise billing cycles. Days payables outstanding sat at 16 days as of FY26, confirming quick vendor payments.
Veeva also receives upfront money from customers that is classified on the balance sheet as deferred revenue, or unearned revenue. This typically represents about 50% of total revenue each financial year. This cash collection profile is highly favourable for Veeva’s balance sheet as they receive customer payments first before delivering the full service. Operational execution risk here is minor because clients are paying in advance for critical software that they already utilize or are actively deploying.
Operating margins are best in class relative to its peer group. When we remove the impact of stock-based compensation from the cost of services, the gross margin increases from the high 70% to near 80%.
In May 2026, the Board authorized a $2 billion share repurchase program to return capital to shareholders. This appears to be a positive signal given that the company has never paid dividends and maintains an exceptionally strong cash position. As an additional rationale for the stock buyback, it could serve as a strategic method to offset the dilution caused by the company’s SBC program, though this remains an assumption.
Contract Structure, Customers, & Channel Checks
Veeva’s contracts are subscription-based models. Subscription costs are not publicly available from Veeva as clients are given bespoke pricing to suit their needs. However, sources online put the typical range between $600 and $2,400 per user per year.
The contracts have an annual cycle as the deferred revenue and accounts receivable figures are cyclical. The largest changes occur in 4Q each year, where customers simultaneously pay their subscriptions and renew. Deferred revenue is 55% of the subscriptions segment on the fiscal year, which is typical for a subscription model.
Survey Outreach
In order to get direct feedback from users, we emailed key partners (and IR teams) listed on Veeva’s website to enquire.
Companies listed on Veeva website as key partners:
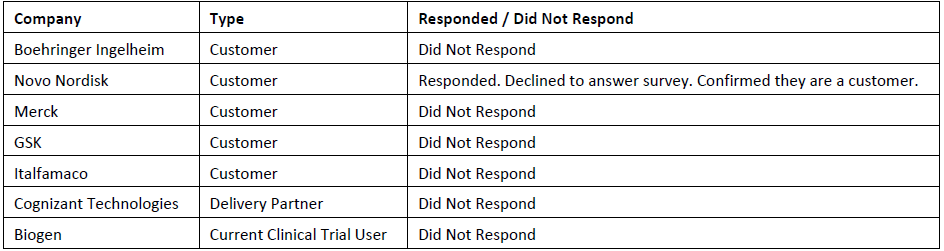
Each company type was sent a slightly different set of questions.
Veeva also has a website where we can search for clinical studies happening now. Biogen and Gilead are currently conducting trials in Melbourne. They were contacted to see if they are using Veeva.
Survey Responses
Unfortunately, only Novo Nordisk responded to the survey. Only confirming that they are indeed a customer.
Employees
Reviewing Glassdoor for employee reviews, 73% approve of Peter Gassner. Their average employee score out of 1,519 ratings is 3.5, whereby 60% of staff would recommend working there. Veeva’s score is average on an absolute basis but is within 1 standard deviation of the Information Technology sector. The main criticism from employees is senior management.
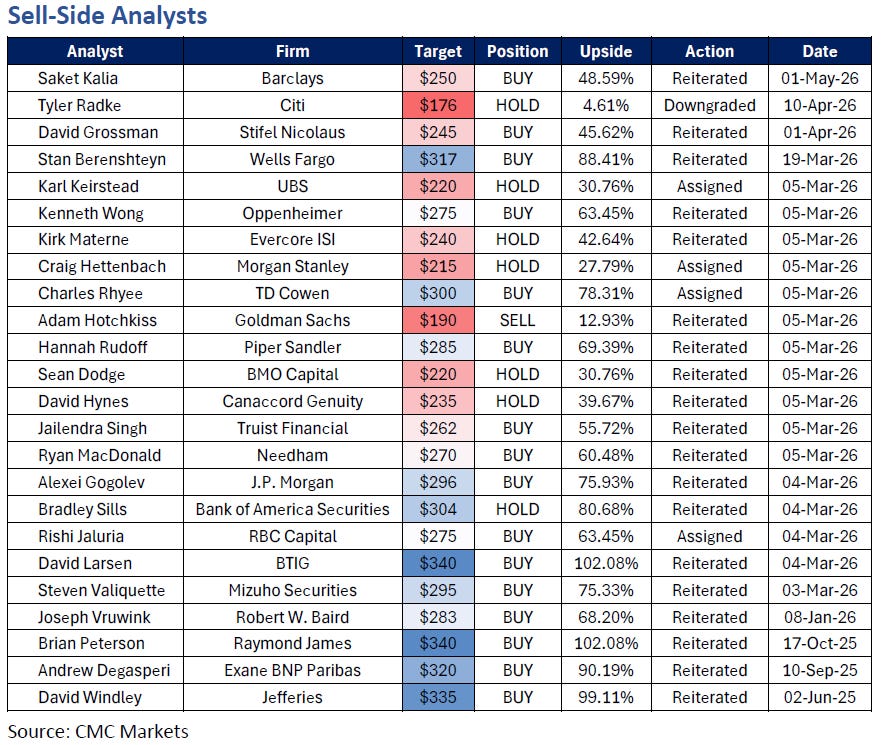
Sell-Side Analysis
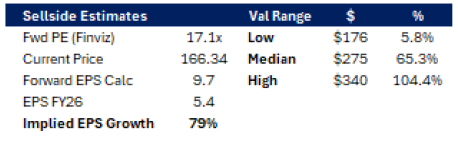
Veeva is a well-covered stock, with upwards of 20 broker analysts actively forecasting the company’s performance as shown in the Appendix. The majority of analysts have recently recut their price targets because the quarterly earnings call has just been completed. The median target price sits at $275, representing a 65% upside from the current share price. The earnings call notably had analysts excited by the growth prospects of AI integration across the business.
Current forward P/E multiples from the sell-side have Veeva trading at roughly 17x. Based on my calculations, that multiple implies an 80% growth in EPS above our baseline estimates.
To mitigate macro distortions, our model introduces intentional forecasting conservatism using a strict historical harmonic growth rate framework. In the first year, projections assume top line growth rates remain flat, in line with historical harmonic performance, to insulate against near term fluctuations. Future years were forecasted using the harmonic average which steps up gradually, scaling at a rate slightly exceeding the company’s calculated cost of capital.
The sell-side median target price of $275 is very near our bull case target price of $285. This suggests sell-side growth expectations are incredibly high. However, Veeva remains a solid investment even under more conservative assumptions.
However, given the high hurdle set by consensus, any minor miss would likely trigger near-term share price retraction, especially as sell-side analysts remain structurally cautious regarding broader sector multiple expansion.[1]
[1] CMC Markets
Supplier Analysis
As a software provider, Veeva’s suppliers are primarily cloud infrastructure and technology partners. Historically, Salesforce was a critical partner, providing the core platform for Veeva CRM. However, Veeva is actively insourcing by moving its core applications to its proprietary Veeva Vault platform. This transition is significantly reducing its structural dependency on external providers like Salesforce, which now effectively becomes a direct competitor.
Amazon Web Services is Veeva’s primary cloud infrastructure partner. This relationship is critical to Veeva’s daily operations. As the business grows, Veeva will inevitably require more capacity from data centre cloud services for the storage of data it collects, as well as the substantial computing power required to run the AI tools on its platform. This expansion will naturally increase the expense line for data centre capacity. The main risk here is that Amazon possesses the pricing power to pass through higher energy and internet costs, at least until more aggregate data centre supply comes to market.
In terms of overall costs, Veeva explicitly states in its financial reports that the vast majority of their operational costs are employee related expenses.
ESG Analysis
As mentioned earlier, Veeva is a Public Benefit Corporation, and ESG is core to Veeva’s charter. The company has committed to reducing absolute Scope 1 and 2 emissions by 58.8% and Scope 3 emissions by 63.8% per million USD of gross profit by FY2035. For the fiscal year ending January 31, 2025, Veeva reported approximately 55,000 metric tons of CO2e emissions.[1]
Veeva also has a 1% Giving Program, whereby Veeva provides 1% of an employee’s salary to support a non-profit of the employee’s choosing.
Morningstar has assessed Veeva as a 4 Star ESG company with a low-risk rating. One area of concern from their assessment is data privacy and cyber security. This is mitigated by Veeva’s ownership of Crossix, which is explicitly designed to manage data privacy and tracking.
Management share options have vesting rules that are highly favourable to investors. Shares need to be above the 52-week high for 60 days, and options are then exercised at that 52-week high price. This provides an excellent alignment with shareholders and prevents insiders from benefiting on lower strike prices when the broader share price falls. Employees also receive shares as a standard part of their core compensation. This creates great alignment of the broader staff to Veeva’s purpose and long-term growth.
Governance
Veeva’s transparency regarding compensation and other adjacent topics is very positive. They openly disclose non-employee director compensation plans as well as disclosing the annual total compensation difference between Mr. Gassner and the median employee, which stands at $470,833 and $140,473 as of FY26, respectively. Unlike other highly specialized and competitive technology industries, Veeva actively promotes that it does not mandate non-compete agreements for staff. This progressive policy likely increases Veeva’s staff retention because employees are not locked out of their industry by leaving.
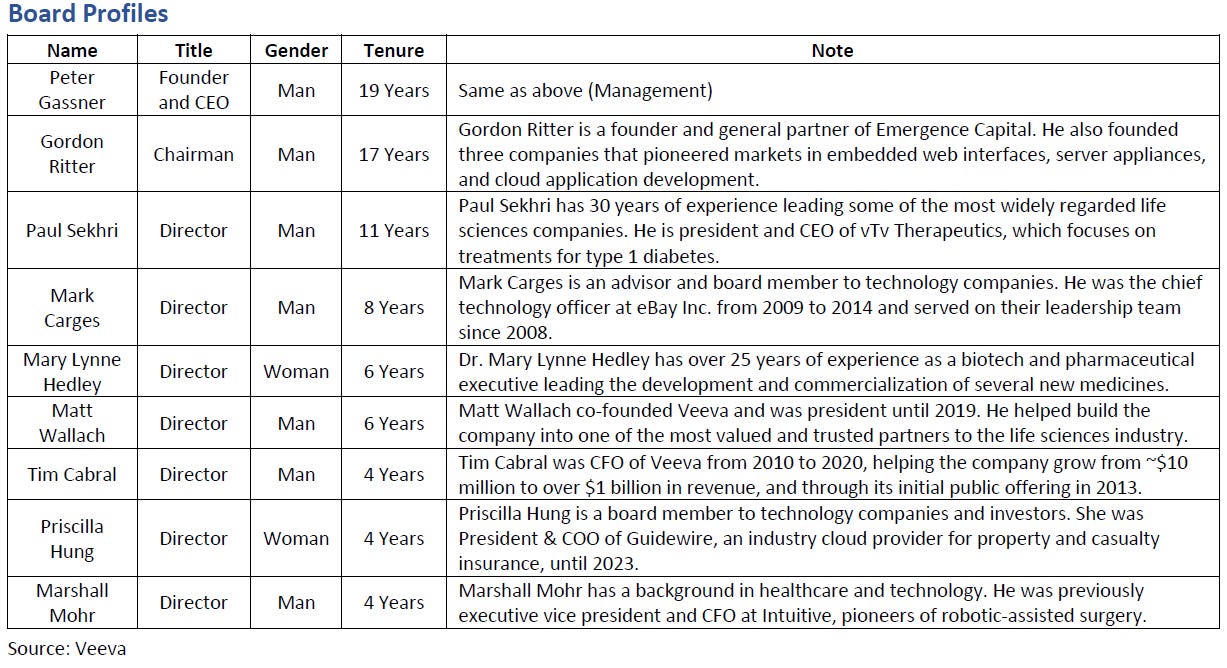
Board Composition
The board consists of individuals with a wealth of experience across software development, healthcare, life sciences, and robotics. Many have held positions at other highly successful medtech companies, such as Intuitive Surgical, or currently sit on the boards of other adjacent businesses.
On the downside, the majority of the board are men. Having a more diverse board in both professional skillset and life background would add a distinct benefit to decision making. In addition, a couple of the directors are co-founders of Veeva or former management. There is an inherent risk of biased decision making and outsized influence when you have 3 of 9 votes more than likely to vote in lockstep with each other. A full list of board members is available in the Appendix.
The CEO and Chair roles are held by separate individuals, which is a classic sign of strong corporate governance.
Auditor Report
A valid cause for concern from a governance best practices standpoint is that Veeva’s auditor has been servicing the company for 10 years. A common rule of thumb is that the external auditor should be rotated or at least have the contract go out to tender every 5 years. While there is no evidence suggesting Veeva did not go to market for an auditor, the perceptive risk is present. There have been historic corporate examples where an unrotated auditor rubber stamped financials to preserve a lucrative contract.
The auditor’s report also noted a Critical Audit Matter. Because Veeva has multiple service offerings spanning Subscription vs. Professional Services and uses various IT applications to track them, the auditor stated they had to deploy specialized IT methods to collect the data and use significant auditor judgment to assess it. This technical complexity did not change their clean audit opinion however.
[1] Veeva, 2026
SWOT Analysis
Strengths
Holds a commanding lead in the CRM space, with 80% market share.
Gross margins are extremely wide at 86% for subscriptions business.
Recent inclusion in the S&P 500 and a large institutional backing make confidence in the company grow.
The company has a strong balance sheet with no debt, lots of cashflow, short term investments and cash.
The industry has high switching costs. Clients are more than likely to remain on platform after Salesforce separation.
Weaknesses
High concentration in North America, but with growing revenue segment in Asia.
Veeva operates in a niche segment, life sciences and has a commanding share. Future growth is likely only possible in other sectors and or more growth in non-USA markets.
Considering Veeva’s strong balance sheet, it has not distributed any dividends. The concession is the buyback program.
Opportunities
Expansion into adjacent regulated industries will provide more avenues for growth and a diversified revenue mix.
With a healthy balance sheet, Veeva could acquire other smaller businesses to add to its verticals. The only risk is they acquire a company outside of its core competency just to grow.
AI-driven software layers are being included in Veeva’s products. Clients are enjoying the additions and the use cases for AI in life sciences. In addition, clients have themselves been implementing variations to the standard AI agent for their uses.
Threats
Increased competition from competitors. With such high margins and market share, competitors could be more aggressive with pricing just to win clients.
Should the R&D spending in life science slow, this would dramatically impact Veeva’s primary and growing segment. Legislation is currently favourable. With the current OBBB Act, there is a sector tailwind for at least the next 4 years.
AI threatens software business models. Currently a majority of the business is subscription per user based. Veeva is exploring usage-based models which should mitigate some of the risk. However, if clients are becoming more efficient with better models, the number of users and the usage may drop.
Valuation
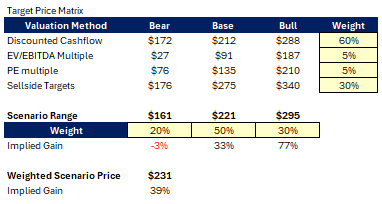
Multiple valuation methods were used to determine intrinsic value. A traditional DCF model using EBIT, an EV/EBITDA multiple valuation, a P/E multiple valuation using the median of peers, and aggregated sell side targets were all deployed.
Target prices for bear, base, and bull cases were established and weighted. Relative multiple valuations were assigned the lowest internal weights because they represent blunt estimates, and the range across the peer group is too wide to provide predictive value.
Sell side estimates were given a reasonable weight of 30% to acknowledge active analyst coverage, and their own detailed forecasting.
In the final aggregation, the weighted scenario matrix was used to combine the bear, base, and bull cases on the likelihood of the outcomes. A larger probability weight was allocated to the baseline case. The resulting combined target price is $231, implying a 39% gain on today’s trading price.
The recommendation for Veeva is BUY.
Even based on conservative forecasting estimates, the DCF bear case still indicated the share price is trading below its intrinsic value.
Below is more detail on our assumptions and valuation methods.
Assumptions:
As per Veeva’s annual report they expect all of their costs and expenses to increase in future.
Higher R&D and Opex increase more from employee compensation
Sales & marketing higher from pushing products, with the hope of upselling.
Admin cost expected to decrease.
Revenue growth is forecasted using the harmonic mean of prior 4 years (pcp) quarterly growth rates and assume long-term regression to the mean. To reflect mid-market market-share gains, the model applies a 1.5x growth factor onto this harmonic baseline from FY27 to FY31, establishing a conservative annualized revenue growth rate of 8.4%, below the company’s WACC (9.6%).
The blended corporate growth projections roll up to a combined FY27 revenue growth rate of 11.9% across all business segments, tracking below historical rates.

When rolled up we can see the FY27 growth rate is 11.9% for the combined business segments. This is below the prior FY rates.
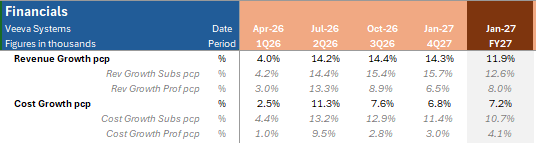
Operating costs are modelled to expand at 14.9% per year for 5 years, representing a 2.0x growth multiplier relative to revenue growth from FY27 to FY31. Modelling structural costs growing faster than top-line revenues establishes a highly conservative margin of safety for the final valuation metrics.
Discounted Cash Flow
Traditional DCF using EBIT (operating income) as a starting point, adding D&A, less changes in WC, Capex and tax. The effective tax rate was use rather than the corporate tax rate.
WACC of 9.6% was derived from:
10-Y US Treasury bond rate of 4.40% as of 05 May 2026.
Equity risk premium estimate of 4.46% from Aswath Damodaran, well known professor with expertise and data in valuation and ERP.
Beta of 1.17 based on the average of various sources and calculations (daily & weekly regression of share price to index, and Aswath Damodaran estimate for the sector).
There is no debt, so WACC is entirely cost of equity.
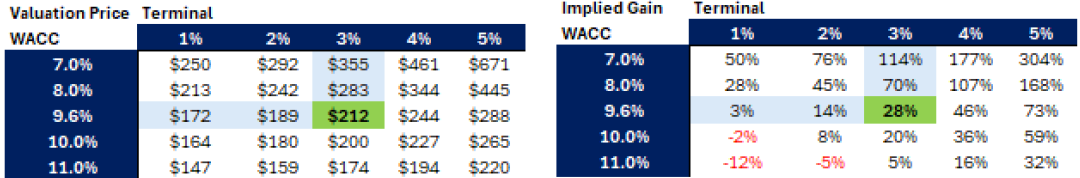
Using this method calculated a valuation price of $212.32 (27.6% implied gain) using a 3% terminal growth rate
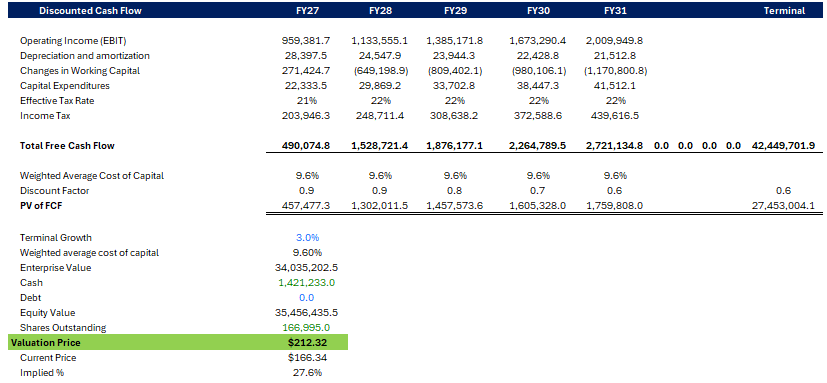
A valuation price matrix was constructed using slight deviation in terminal value (ranging from 1% to 5%) and WACC (7% to 11%). Using the ranges we calculated the various valuation price and their implied gain or loss on today’s price.
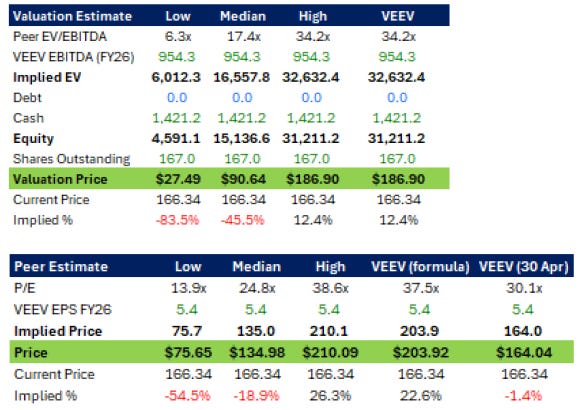
Multiples Valuation
This method has been mentioned in the competitor analysis section. Using the EV/EBITDA median of the competitors, the implied EV and valuation price of Veeva was estimated. This was also done using the P/E median except PE was used to find the implied EPS for Veeva, then the valuation price. The metrics for Veeva’s peer group of competitors was source from various outlets.
Based on this method, Veeva appears to be trading at very high multiples to the median peer group.
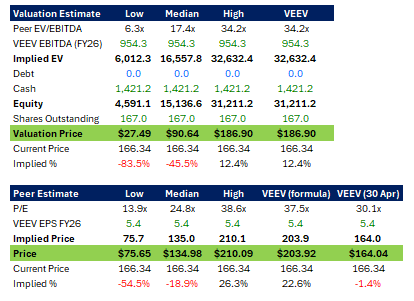
However, one caveat is the peer group is broad in scope. Some are very large like Salesforce and Oracle, which have diversified software businesses, not just life sciences. Others were small niche players such as Certara.
Sell-Side Valuations
There is value is comparing the sell-side valuation estimates. Using information from CMC Markets, we gathered the listed of analyst who cover Veeva to aggregate their share price forecasts. Almost all of which have recently been updated
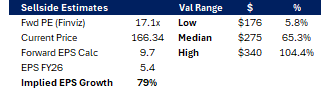
Sell-side estimates have and implied EPS growth rate of 80% based on a forward PE multiple (source from Finviz). Tabulated are the lowest, median, and highest valuation targets for the stock.
Appendix
Veeva Survey Questions
With the Salesforce partnership sunsetting, what has the response been from early migrators to Vault CRM compared to legacy users?
Are you seeing any increased churn or a higher upsell rate into the wider Vault suite during this transition?
What has been the impact on the topline as a result of the OBBB Act’s R&D tax deductions?
With AI agents being implemented in Vault, is Veeva exploring usage or token-based subscriptions as well as per-user?
Is there an ideal subscription model mix target?
Have clients been utilizing the AI agents and what has been their response?
With the recent stock buyback program announcement, is this intended as an offset to the employee stock-based compensation program?
Does Veeva expect buybacks at regular intervals and sizes?
A recent industry report from IQVIA cited that China has seen a significant increase in global trials usage. Are you seeing a shift in your customer mix toward local Chinese biotech firms?
Are there any specific regulatory hurdles unique to the region?
Customer Survey Questions
Product
Which Veeva products (e.g., EDC, Vault, QMS, RIM) do you use?
What specific business problem were you looking to solve when you chose Veeva?
What were you using before Veeva (a specific competitor, or an internal/manual system)?
If you switched from another provider, what was the “tipping point” that made you move to Veeva?
Experience
What does Veeva do better than the competitors you’ve seen or used?
Are there any particular features you like?
Are there any particular features that could be improved?
Satisfaction (1 = Strongly Disagree, 5 = Strongly Agree)
Veeva’s products provide significant value relative to the time and effort invested. [1] [2] [3] [4] [5]
I am highly satisfied with the responsiveness and expertise of Veeva’s customer service. [1] [2] [3] [4] [5]
Our organization is likely to expand our use of Veeva tools in the future. [1] [2] [3] [4] [5]
Delivery Partner Survey
Product Implementation
Which Veeva products are the most sought after by customers (e.g., EDC, Vault, QMS, RIM)?
How does the implementation of Veeva’s software compare to others?
What other/third party software pairs well with Veeva Systems?
Satisfaction (1 = Strongly Disagree, 5 = Strongly Agree)
Veeva’s products are better than the competitors. [1] [2] [3] [4] [5]
We are highly satisfied with the responsiveness and expertise of Veeva’s customer service. [1] [2] [3] [4] [5]
Our organization is likely to expand our use of Veeva tools in the future. [1] [2] [3] [4] [5]
Clinical Trial Survey
Product
Are you using a Veeva product for the clinical trial, if so which (e.g., EDC, Vault, QMS, RIM)?
Why you did/did not choose Veeva over another providers, if applicable?
Experience
Are there any particular features you like?
Are there any particular features that could be improved?
Satisfaction (1 = Strongly Disagree, 5 = Strongly Agree)
During the trial, Veeva’s product/s has provided significant value relative to the time and effort invested. [1] [2] [3] [4] [5]
We are highly satisfied with the responsiveness and expertise of Veeva’s customer service. [1] [2] [3] [4] [5]
Disclaimer: Content is for educational purposes only and does not constitute financial advice. Always do your own research.