

May 2026 - Capturing the Tech Wave. 14.2% Return Since Inception
Monthly Portfolio Performance - 31 May 2026

Since the inaugural performance month of Paper Mandate, the portfolio has deployed more cash into high conviction ideas and been rewarded for the risk taken. Cash levels remain at 12% providing both a buffer against volatile markets and dry powder to execute on ideas.
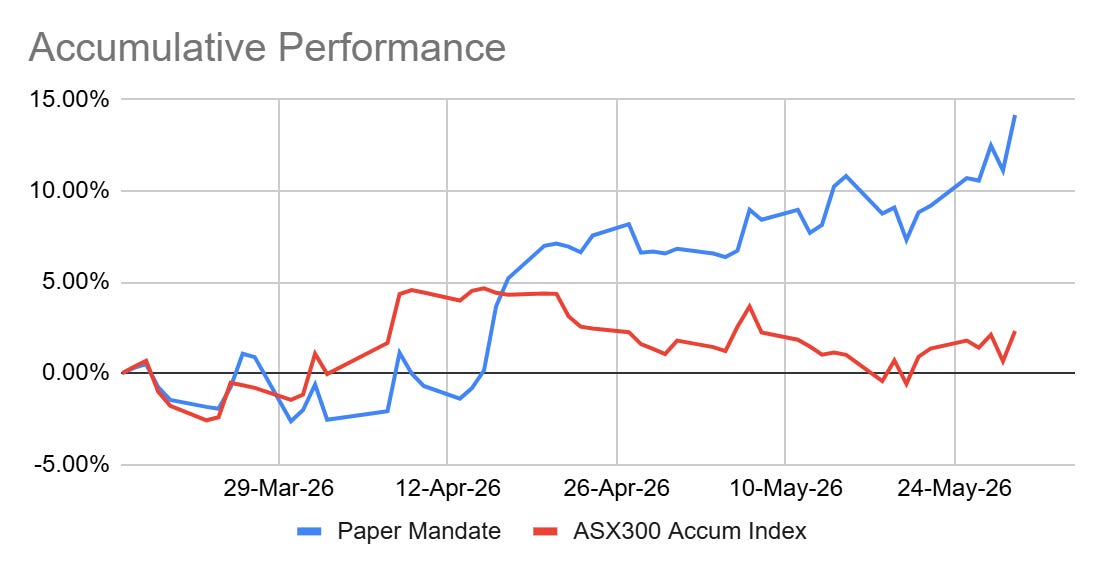
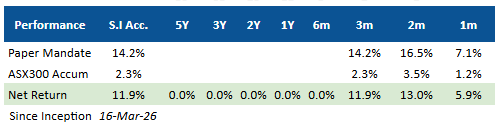
Since inception, the fund has generated a Net Return of 14.16%. This is an alpha of 11.9% above the ASX300 Accumulation Index’s 2.3% return.
The portfolio continued to capture alpha through active management. Being overweight Technology (26.1%) vs the Benchmark weight (2.3%) significantly added to performance.
Active Implementation
We made improvements to the attribution calculation since last month. Previously sector returns each day were not accurately smoothed for the daily return of the portfolio. So when compounded, the trading effect increases over the month.
This has been corrected. Now the daily contribution of stocks is scaled to the daily return of the portfolio, and then smoothed using the Carino Smoothing Method.
In May, the Buy & Hold Active Return was 5.73% (Allocation + Selection + Interaction), with the Benchmark returning 1.25%. The Residual Effect was calculated as 0.16%. Statistically insignificant. Below are the previous performance months restated using the new methodology:
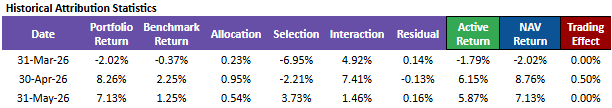
The new method is mathematically sound, proven by the low residual and that the portfolio returns match the percentage change in the portfolio dollar value each month.
Portfolio Attribution
Reviewing the Brinson Factor Attribution tables reveals that returns are coming from stock selection.
The most significant move remains the heavy overweight in Technology (26.1% vs. 2.3%), which contributed 2.7% to the portfolio. Pleasingly the Interaction Effect for Technology was significantly positive (1.9%). This indicates we picked the right stocks and overweighted the sector well.
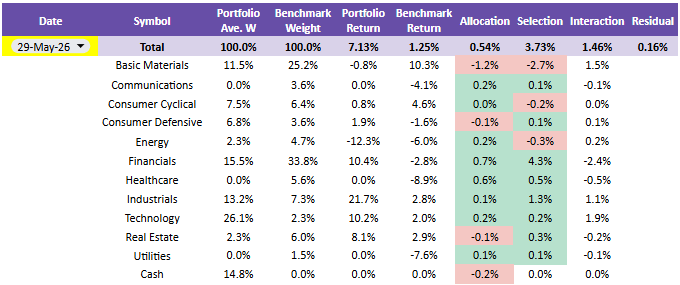
Two other significant contributors to performance were Financials and Industrials. Both provided meaningful returns to the portfolio, as see through the Selection Effect
Once again, avoiding Healthcare entirely generated +0.6% Allocation Effect and +0.5% in Selection Effect.
The single position in Energy (WDS) was a detractor from the portfolio but at such a low weight the impact was minimal.
An average Cash position of 14.8% created a minor -0.2% Allocation drag. We deployed more capital in the month and trimmed a few positions to take profit.
Portfolio Characteristics & Risk Metrics
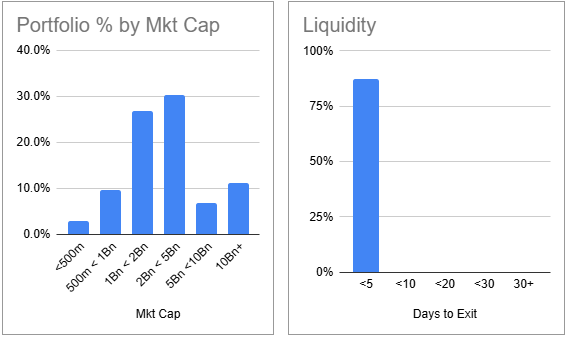
The portfolio’s metrics are as expected. The current profile favours the mid-cap sweet spot, with the majority of companies between $1Bn to $5Bn in market cap.
The portfolio liquidity is well within risk parameters. Considering a 30% Average Daily Volume (ADV), the portfolio has a Days to Exit of 5 days. This is due to the small FUM size.
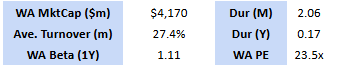
Other statistics included the following:
Weighted Avg Mkt Cap: $4,170m, smaller than the $ 9,799m of the ASX300.
WA Beta (1Y): 1.11, indicating a portfolio is slightly more sensitive to the market.
WA P/E Ratio: 23.5x, higher than the ASX300 20.3x trailing PE. Portfolio is more expensive given the holdings are on the growthy side.
At the end of the month, the largest overweight was Technology (+25.4% ) while the Financials (-17.6%) was again the largest underweight.
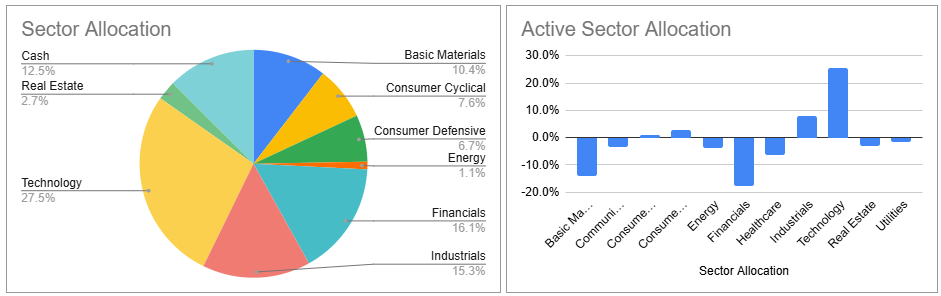
Despite the underweight to Financials, our stock selection in the sector was a positive contributor to performance.
Key Contributors & Detractors
The NAV increased 7.13% during May. The specific positions that drove the return by contribution were:
Megaport (MP1): Largest holding at 8.2%, returning 61.8%. Contributing 5.1%
SKS Technologies (SKS): A 3.6% position returning 46.8%. Contributing 1.7%
Judo Capital (JDO): A 4.0% position returning 19.1%. Contributing 0.8%
HMC Capital (HMC): A 2.2% position returned 31.2%. This could have been a higher weight in the portfolio.
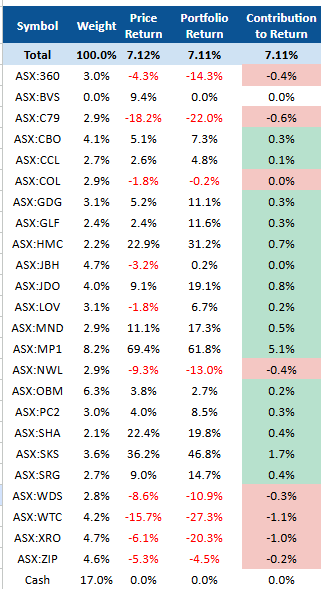
Key detractors were:
Wisetech (WTC): A 4.2%, fell -27.3%. Detracting -1.1%
Xero (XRO): A 4.7%, fell -20.3%. Detracting -1.0%
Chrysos Corp (C79): A 2.9%, fell -22.0%. Detracting -0.6%
Not all technology stocks were beneficiaries of the AI and Data Centre theme. Software continued to sell-off. WTC and XRO, as our incumbent large cap software stock, keep getting caught in the crossfire.
Meanwhile, C79 detracted as the gold price continued to fall. The market is expecting a resolution to the US/Iran conflict. It just a questions of “when?”. In the interim, gold and oil are negatively correlated at the moment. As oil rises, gold sinks. And gold has been sinking more than expected.
There is still a healthy allocation to gold through PC2 and OBM. In anticipation of C79 not performing as well as expected, the position was trimmed over the month.
Outlook & Strategy
The 14.2% absolute return since inception is fantastic. We are incredibly pleased with the performance of the portfolio and the current stock holdings.
The focus for the coming month will be strategically deploying dry powder on opportunities as well as trimming successful candidates like MP1, who continue to rally passed a 12% weight in the portfolio.
Disclaimer: This is a paper portfolio. Content is for educational purposes only and does not constitute financial advice. Always do your own research.