


If you haven’t read them yet, here are Part 1 and Part 2. If you have, thank you and enjoy Part 3.
Intro
This took an entire afternoon. Establishing a model structure that matched the financials, would allow for forecasting, and just finding the information among the disparate reports and media announcements takes a lot more time than first anticipated.
Where to Start
The first port of call was the Divisions tab. Symal has many business units in the group that grow at different rates. They even acquired another one recently, Shamrock (national defence contractor). To forecast methodically, we should get as granular as possible.
We ideally wanted to find the business unit level data from the financials. Unfortunately, Symal does not provide such detail. It does however, separate revenue and expenses into categories; Contract Services, Plant & Equipment, and Other (as a miscellaneous bucket consisting of Recycling, Waste Management etc…).
Another wrinkle is that some business revenue comes from internal sources (Intersegment Revenue), which will be a nightmare to forecast, if we attempt that at all. The most detailed data shows the revenue in each category and the attributed cost lines. This is a good start.
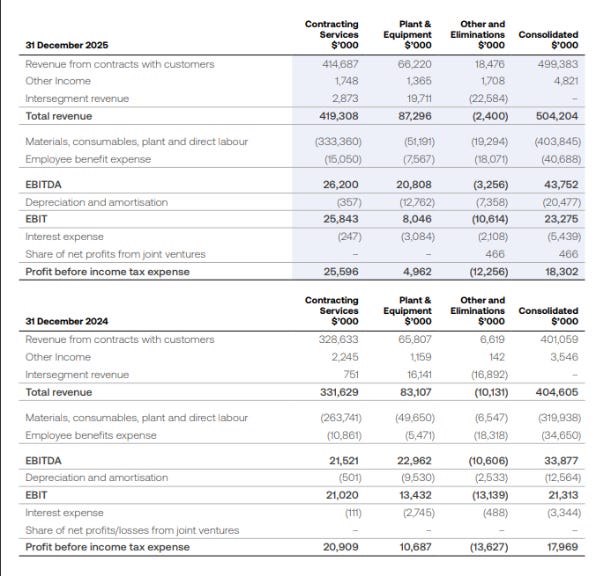
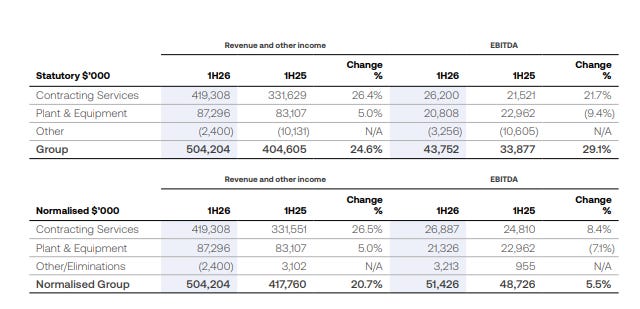
To further add complexity, Symal frequently normalises the financials, which they guide towards. For the time being, sticking with the statutory reporting figures will at least provide consistency.
Division Summary Section
Starting from the most recent financial reports and working backwards, we fill in the half-yearly revenues for each category. Remember: blue denotes manual inputs and black are calculations.
Symal does not provide 2H financials, only 1H and FY. So the 2H figures are calculated as the full year less the first half. We do this for all 2H periods.
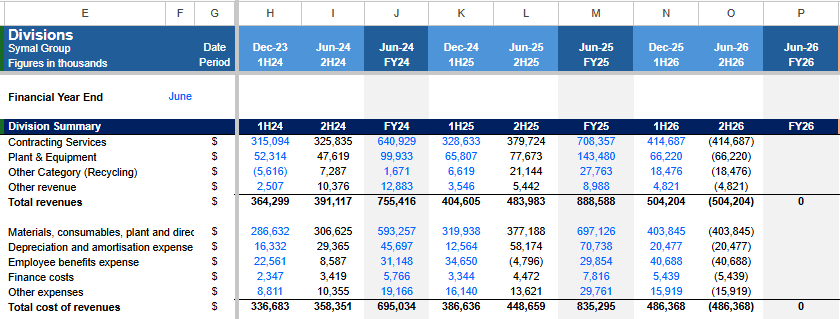
We also plug in the expenses, which sums as Cost of Revenues. The order is the same as the Profit & Loss statement, for ease of comparison to the real reports.
Next we calculate our Gross Profit and EBITDA. The assumption is that the first expense line (Materials, Consumable etc…) are our COGS (Cost of Goods Sold). This is because the EBITDA equates to:
EBITDA = Revenue - Materials - Employee benefit expense - Other expenses
EBITDA = Gross Profit - Employee benefit expense - Other expenses
Both match the EBITDA figures in the financials, so we can be certain the formulas are correct. Included are the GP and EBITDA margin percentages.
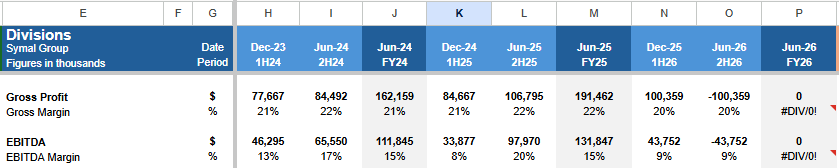
Lastly, we calculate the period to period growth rates for both the revenue and cost lines. As an example, the total revenue growth from December 2023 to December 2024 was 11.1%
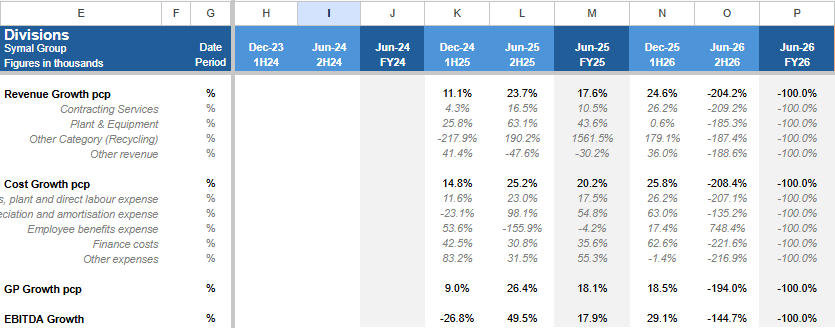
Formulae we know will be needed in future periods are extended across the sheet. So the first section will look like the image below.
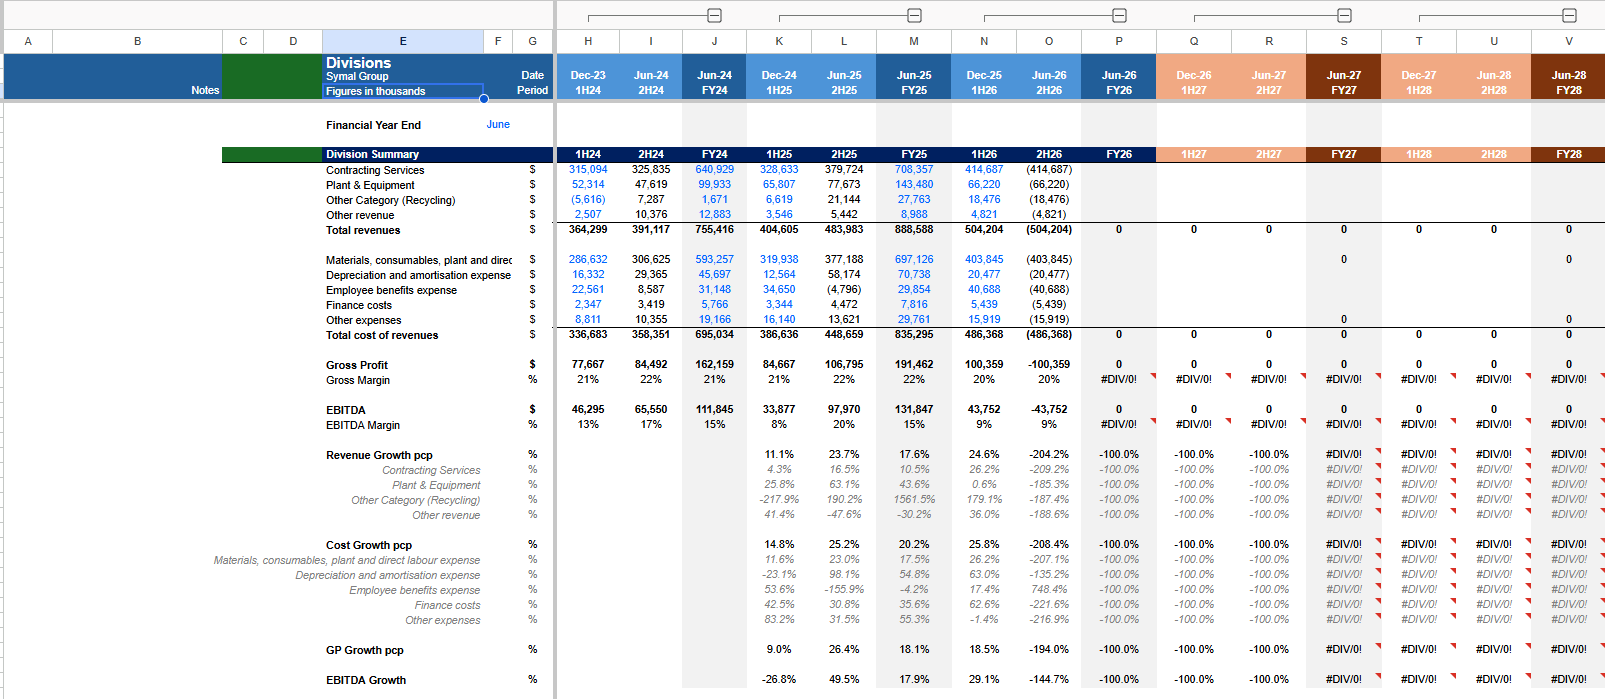
Formula Error Warning: you will spot a series of #DIV/0! errors. Don’t panic. Because we haven’t inputted the forecasted figures, our formulas are trying to divide by zero. We could include an “IFERROR()” to remove the error. However, just know that it will also hide any actual calculation errors needing your attention. You can always add it later.
We pivot here because we needed two things:
A revenue proportion percentage table
An understanding of when Symal bought which business, the cost, and any other details.
Percentage Revenue Proportion
The % revenue proportion is simple enough, calculate which categories contribute the most revenue by percentage.
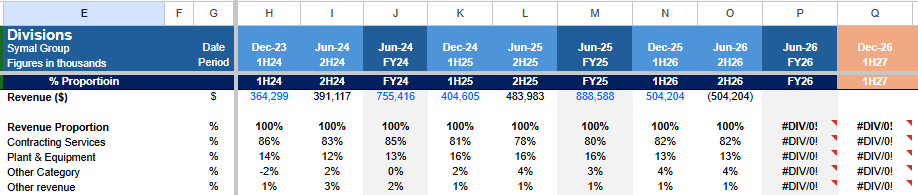
You may notice the revenue dollars in blue. This was to ensure our calculated total revenue at the top matched the raw figure from the financials. It is good practice to have checks in the model. Further down we included a check.

Acquisition Table
Given Symal is a serial acquirer, having a better picture of what was bought, when and how much will help our analysis. Trawling through ASX announcements and media releases we found the relevant acquisition data, specifically date of purchase and the dollars paid.
The EBITDA price multiple was manually calculated as none of the media releases specified it. However, in one investor presentation, Symal notes that most of the acquisitions were between 3-4x EBITDA, so we know what to look for.
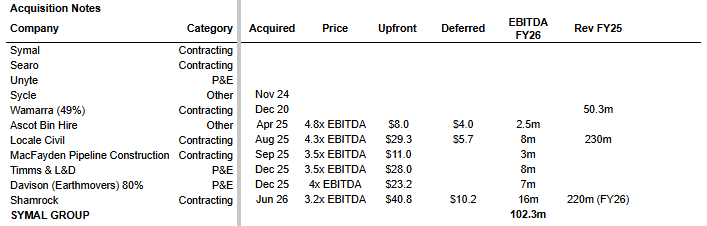
Most of the media releases explained that the acquisitions would be EBITDA accretive by “x” amount. So taking the price paid over EBITDA gives an indicative multiple.
Quick sidenote: We could have asked AI to fetch the information for us (but where is the fun in that?). More importantly, the whole point of this exercise is to build knowledge. So while it is tempting to take a short cut, we urge you to do the work.
Assigning a category to each business unit was, at times, a judgement call. Some were fairly obvious or noted in presentations: Sycle and Ascot Bins in Other & Symal in Contracting.
Other businesses appeared to provide both contracting services and equipment hire. Ultimately the categorisation may have limited use as Symal doesn’t break down the financials to the business unit.
Cost of Revenues Breakdown
With the revenue breakdown segment finished, we have to build something similar for the cost side of the business.
We have our cost categories (Materials, Employee benefits etc…) from the previous section, and luckily Symal specifies the cost breakdown between the business units; Contracting Services, Plant & Equipment and Other.
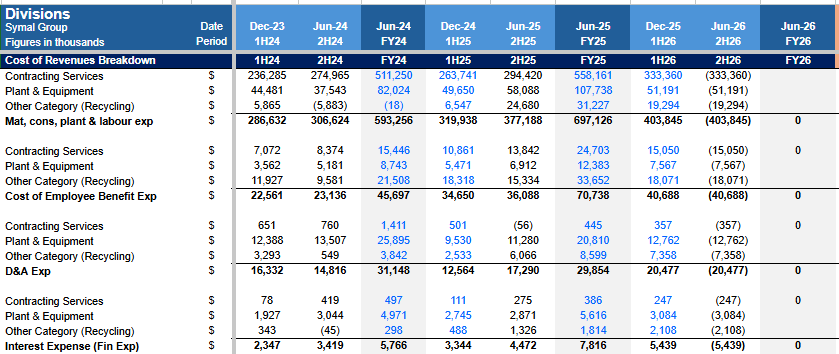
“Other expenses” is tricky. There does not appear to be a business unit level breakdown in the financials. So we apportion other expenses by % revenue. This is where our revenue proportion section comes in handy.
Next time we will determine our EBITDA per business.